Section 1:1 — Introduction to Physical AI
Welcome, Tinkerer, to the frontier of Physical AI—the exciting convergence of physical computing, solid-state embedded hardware, and machine intelligence.
This manual is written as an open architecture to ignite the imagination of a new generation of creators, innovators, and educators. Whether you are an AI Native / Software Maker looking to break out of the flat screen and translate digital intelligence into real-world mechanical action, or a Traditional Hardware Student who can wire a circuit perfectly but wants to unlock advanced local inference (Section 5:4 — Local Inference (Edge AI) Mode) pipelines without drowning in low-level compilation lag, this platform is your gateway.
This workbench is designed to inspire the High School STEM Student aiming for the regional science fair, providing a tactile sandbox where cutting-edge electronics and machine learning become accessible milestones rather than distant academic hurdles. It serves the Undergraduate College Student by bringing textbook theory to life, offering a high-fidelity visual and physical playground to deploy real code into real-world reality.
For educators, this studio connects theory and practice across the entire instructional spectrum. It equips the High School Science Teacher with a turn-key, structured physical framework to run engaging, hands-on lab experiments, while providing the University Computer Science Professor a highly sophisticated, multi-modal edge computing testbed for advanced physical computing curriculum and robotics research. The VTM Pro Maker Workbench is an open framework built to show every level of creator that they are no longer limited by what they don't know.
Just 5 years ago, pioneering a custom electronic system or programming an automated mechanism demanded years of specialized study in low-level assembly languages, advanced calculus, and complex circuit architecture. Frustrating syntax errors, confusing formulas, and institutional friction created formidable barriers to entry.
Today, the electronics landscape has fundamentally changed. We are witnessing an evolution moving faster than anything the tech world has ever seen, compressed into a timeline that moves at lightning speed. In a matter of months, solid-state innovation has swept past simple text generation, bypassed autonomous software agents, and collided directly with the era of Physical AI—where digital intelligence breaks out of the screen and takes physical form. Advancements in local edge computing and multi-modal models have completely shattered the traditional barrier between code and copper.
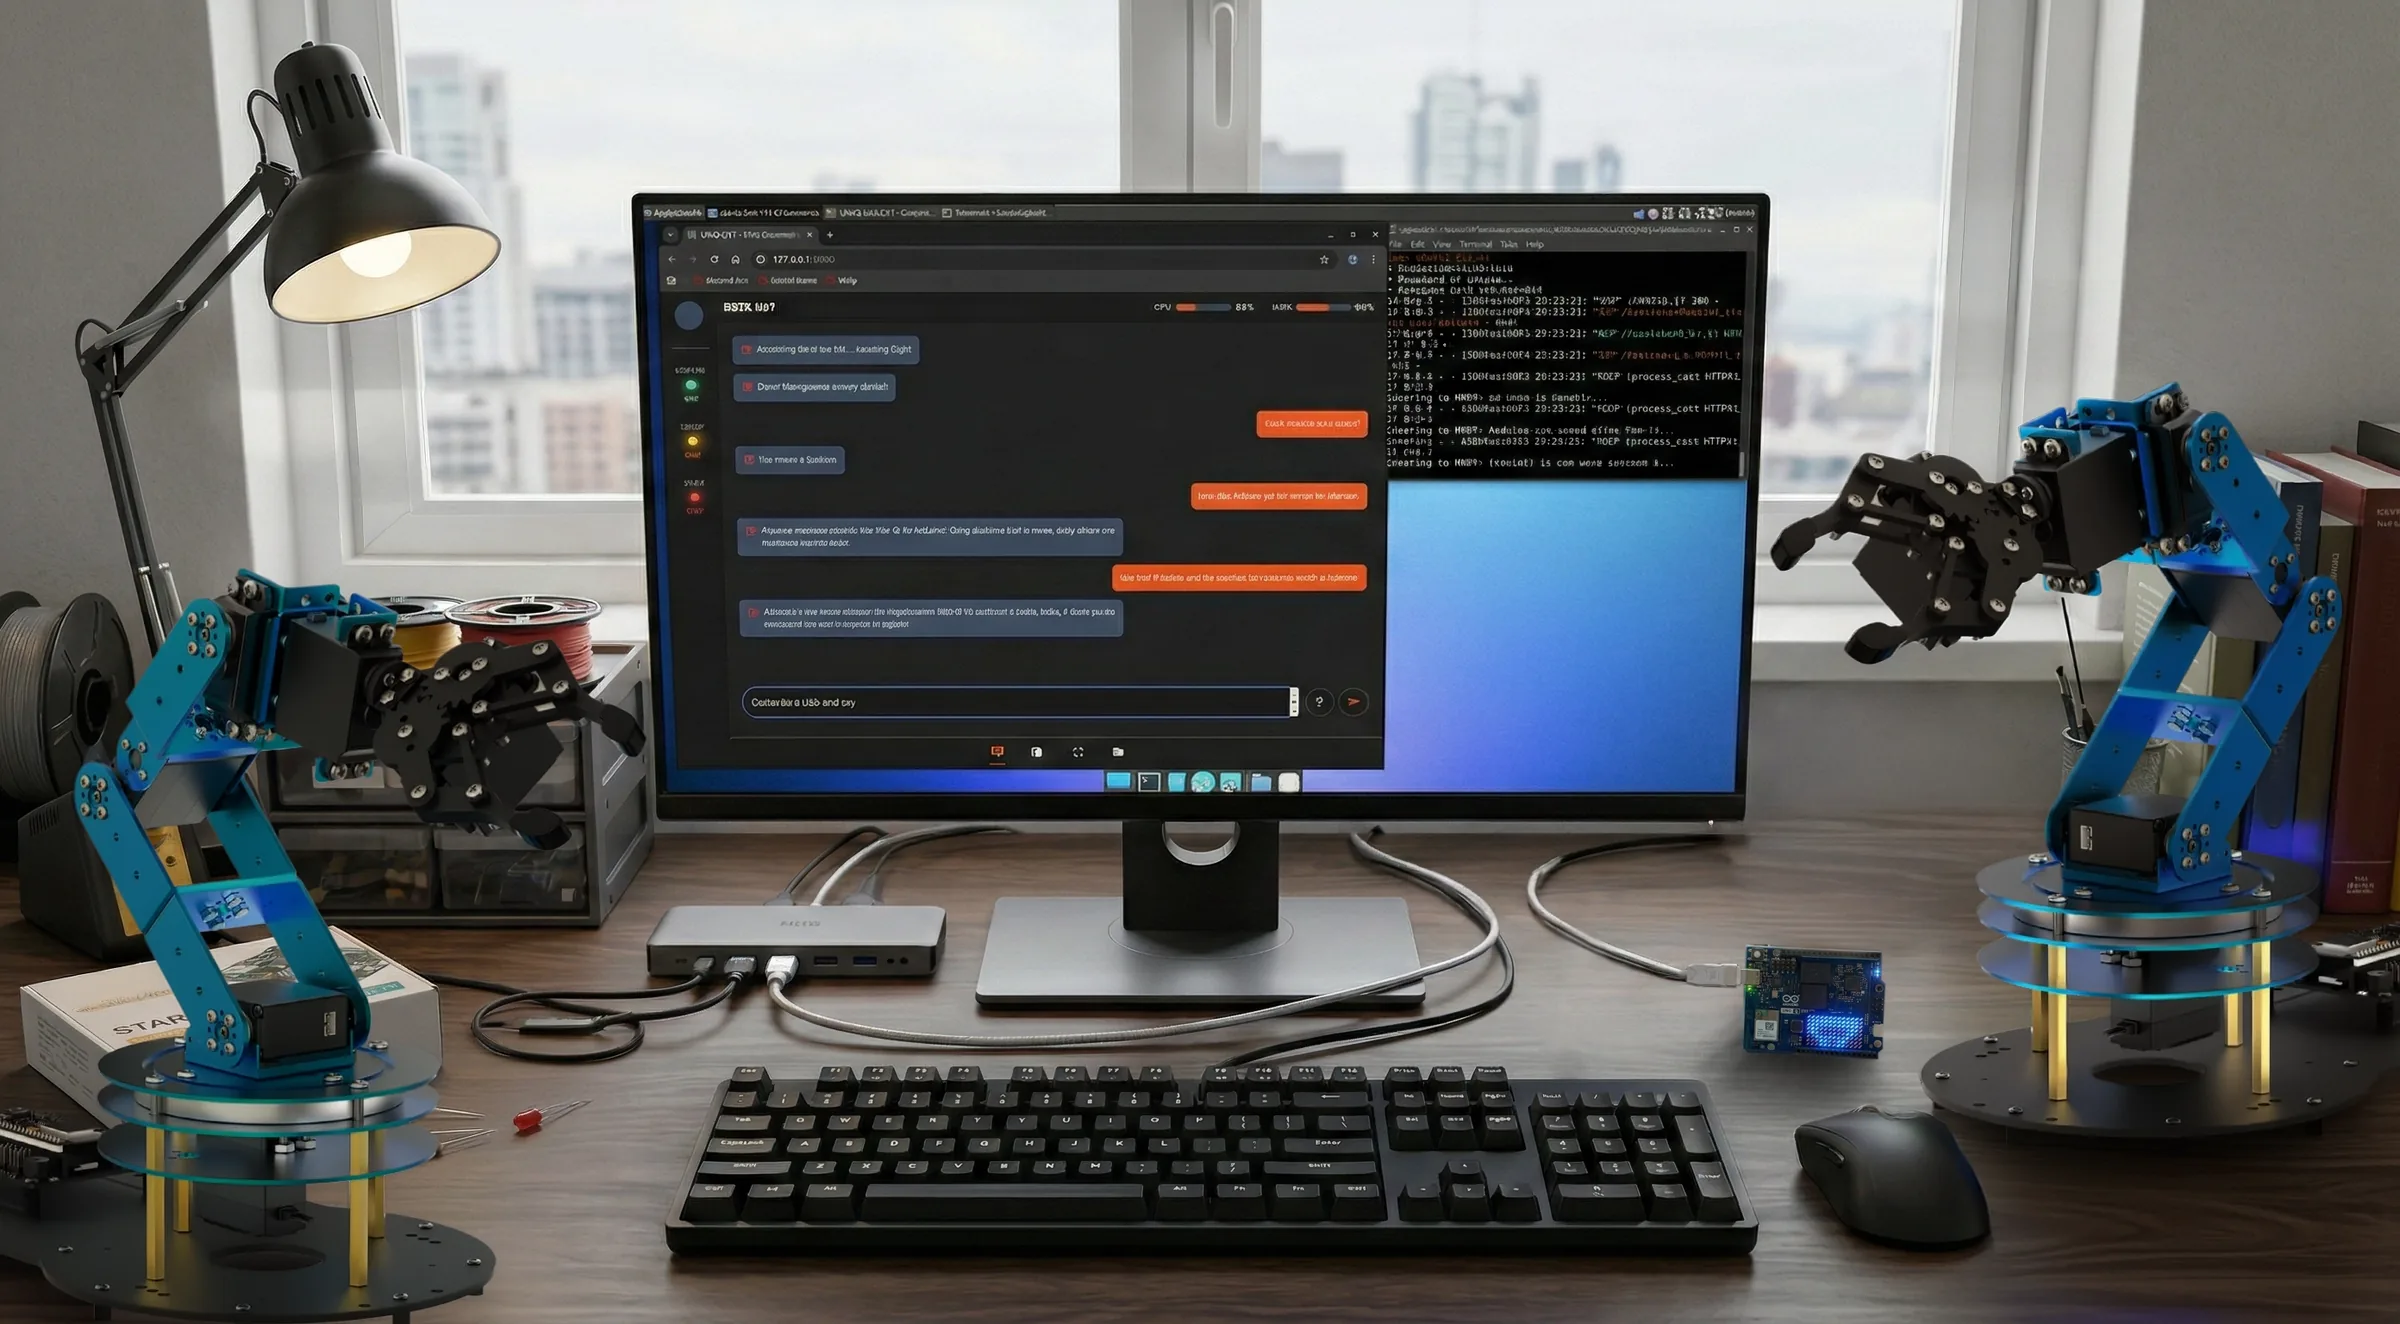
The VTM Pro-Maker Workbench starts with the software—VTM Studio—and leads to
your physical build of whatever you can imagine: a desktop robot torso with arms, one of the
P³ (Physical Prototyping Platform) build concepts (Maker Pro P³,
Chef P³, Fitness P³, Entry Sentry P³), a physical computing
workstation, a multi-display console, or a rack of lights and sensors. It proves that hands-on
learning can be achieved right at your workstation without a formal computer science
degree, transforming the way you work with microcontrollers,
solid-state electronics, and embedded hardware.
You do not need prior mastery of coding syntax, advanced mathematics, or semiconductor physics to execute complex hardware engineering. The AI architecture integrated inside VTM Studio functions as an on-demand embedded engineer, master coder, mathematician, and technical writer. With the historical barriers to entry eliminated, your role shifts entirely to strategy, layout aesthetics, and conceptualization: you imagine, create, and iterate.
Section 1:2 — Creative Freedom
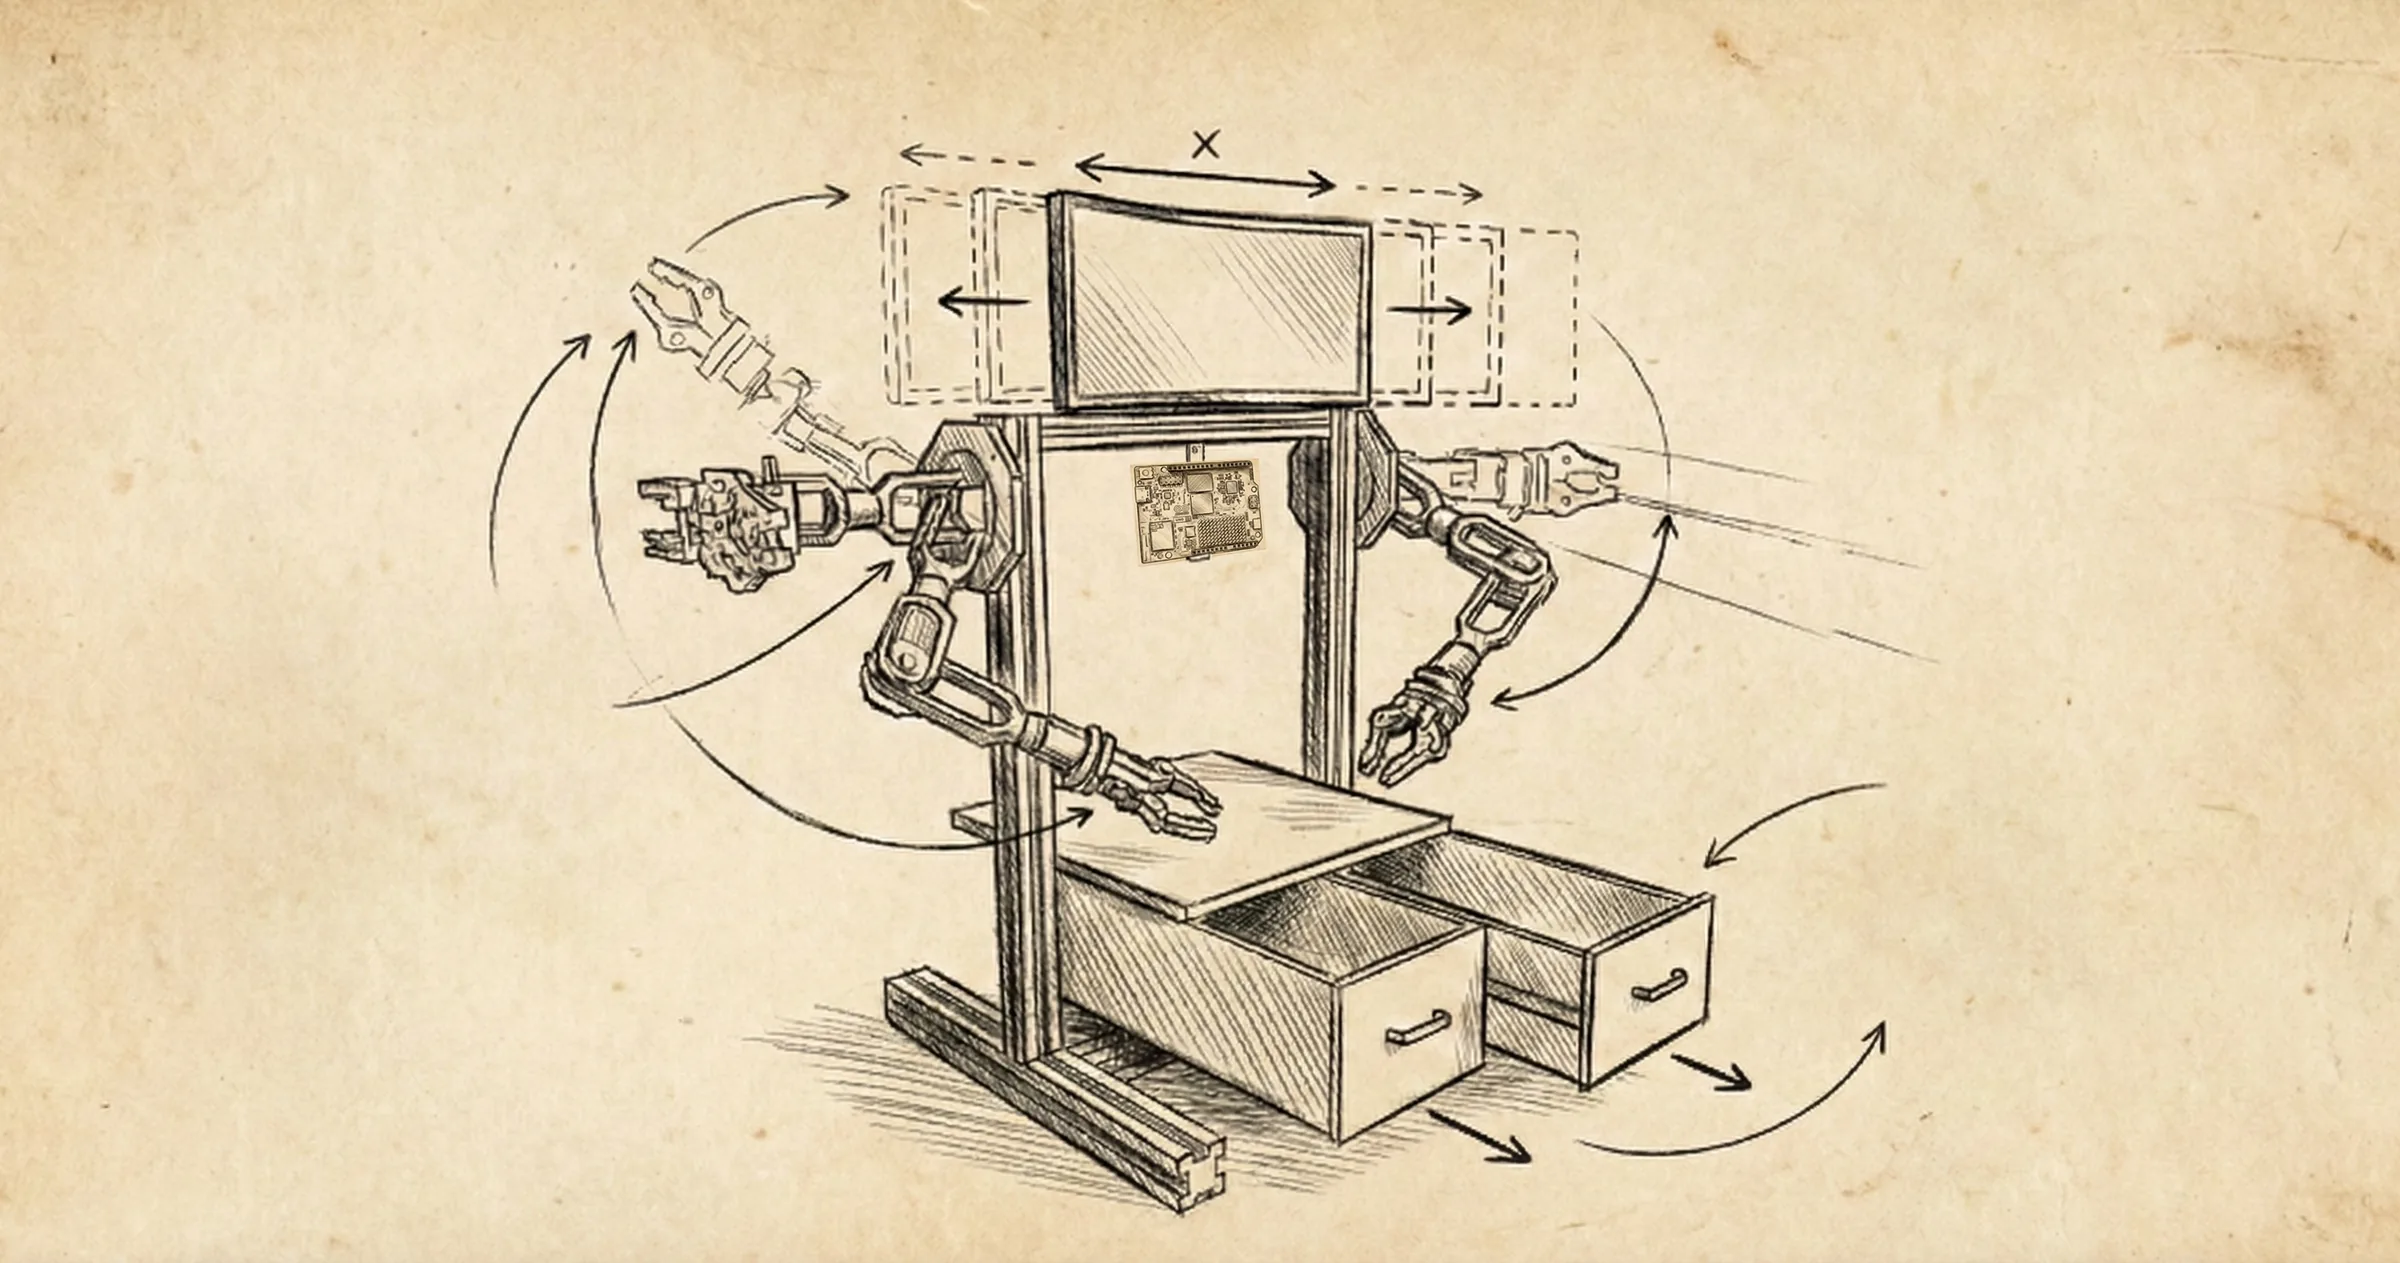
The VTM Pro-Maker Workbench starts with the software—VTM Studio—and leads to
your physical build of whatever you can imagine: a desktop robot torso with arms, one of the
P³ (Physical Prototyping Platform) build concepts
(Maker Pro P³, Chef P³, Fitness P³, Entry Sentry P³),
a physical computing workstation, a multi-display console, or a rack of lights and sensors.
You do not need proprietary hardware to use VTM Studio; it works directly with the boards, servos, sensors, and cameras you already own. The dual robotic arms, the digital multimeter, and the persistent media logs are concrete, hands-on examples of what is possible when you merge human imagination with physical computing and artificial intelligence.

This platform was built knowing that this exact architectural foundation can scale from a desktop workstation or sensor rack into a full-size robot equipped with environmental sensing, spatial tracking, and mechanical manipulation capabilities. VTM Studio is your launching pad where software pipelines, local offline audio loops, and hardware serial bridges work together.
The goal of this platform is to show you—by doing, by wiring, by testing, and by building—that you are no longer limited by what you don't know. Once you learn the workflow of technical delegation on this workbench, you can swap the parts, adapt the code, and apply this structure to build whatever your mind can dream up.
Section 1:3 — The VTM Design Philosophy
The VTM platform is designed around two core principles: long-term utility and workflow integration.
A Permanent Lab Tool
Rather than a temporary setup for a single project, the VTM Pro Maker Workbench is built as a permanent, modular asset for ongoing learning, prototyping, and data collection.
Integrated Context
Traditional workflows often require manually copying code, describing hardware setups, and re-entering telemetry to get an AI assistant up to speed. VTM Studio streamlines this process by maintaining continuous awareness of your active code, layout selections, and hardware state.
By combining local edge-AI processing with online cloud engines, the system gives makers direct control over their data, processing speeds, and physical hardware.
Section 1:4 — What You Can Do with the Platform
The VTM Pro Maker Workbench is a highly versatile launching pad for physical computing. As a turnkey framework, the environment equips you to:
Synthesize Physical & Digital Circuits
Lay out breadboard wiring diagrams digitally in Layout Mode, or drop down to a physical breadboard to measure real-world DC voltage, resistance (Ω), and continuity over USB serial in Meter Mode and Science Mode.
Deploy Local & Hybrid AI Models
Run local, quantized .gguf language models directly on your
machine for offline Edge AI inference, or connect to cloud-based frontier
models (Google Gemini and Groq) for deep engineering analysis.
Hands-Free Voice Control & Narration
Execute hands-free, eyes-free workstation tasks using built-in voice readback and speech-to-text dictation to navigate modes, control your layout, or record project observations while your hands are full of wiring.
Section 1:5 — Learn Robotics & AI: Two Paths to Build and Learn
Learning robotics and artificial intelligence on the VTM platform is achieved through hands-on exploration. Rather than trying to replace the textbook, the platform allows you to integrate dynamic educational resources directly into your workflow—whether that means reading open-access engineering textbooks in Study Mode with ARC T – A or logging your own custom technical notes right inside the environment. There are two distinct creations in the VideotronicMaker lineage depending on your goals:
VTM STUDIO™ (VERSION 2.2)
Commercial Desktop Workstation• Ready-to-use modes & tools • Built for macOS, Windows, Linux & SBCs
VTM OS (v1 PROTOTYPE REPO)
Free & Open-Source v1 Prototype• Inspect early prototype code & experiment freely
VTM OS (VideotronicMaker-OS) was an early,
standalone v1 prototype made free and open-source on GitHub for the maker community.
VTM Studio (Version 2.2) is a separate, comprehensive
commercial desktop software workstation featuring dedicated engineering modes, interactive Study Mode
textbooks, local model compaction in Model Forge, and hybrid Cloud and Edge AI. On this workbench, you
learn to actively apply AI across software and hardware layers:
Learning Technical Delegation
You learn a practical modern workflow—retaining control over the art, design, and system architecture while delegating low-level execution (C++ sketches, Python routes, and circuit calculations) to specialized AI models. This is the exact method used to build VTM Studio.
Direct Multi-Axis Servo Control & Calibration
Control physical robotic arms and servo mechanisms directly over USB serial using
per-joint sliders (0–180° MG90S PWM and
0–1000 bus-servo ticks), 1° mouse-wheel
scrubbing, posture presets (HOME, STANDBY, GRIP,
RELEASE), two-way X-Panel mirroring, and the BYOH Custom Protocol Builder.
Vision-Guided Manipulation
Learn how cameras track targets by passing live video feeds into Vision Mode (VTM Vision object detection, HSV Lock color tracking, and Cloud Vision analysis), mapping real-time 2D bounding boxes onto the video canvas and syncing target coordinates with your servo hardware.
Understanding Model Optimization
Through the 3-tab Model Forge studio
(1. Convert HF, 2. Compact GGUF, 3. Run Model),
you get practical experience converting local Hugging Face .safetensors
weights to .gguf, quantizing to 4-bit (Q4) or 8-bit (Q8), and hot-swapping
.gguf models live inside the local inference engine.
Context Engineering
By working alongside ARC (Main Chat), VAS-X (content-aware workstation navigator), and ARC T – A (Study Mode textbook tutor), you learn how to combine cloud reasoning with local hardware telemetry and documented build logs.
Whether you use the commercial VTM Studio (Version 2.2) workstation for your daily builds or explore the separate open-source VTM OS (v1) prototype repository to study early Python and JavaScript experiments, you are encouraged to use AI assistants to generate custom sketches, wire real circuits, and build whatever physical project you can imagine.
Section 1:6 — VTM Store Mode & Workbench Tier Unlocks
VTM Studio™ is architected as a modular physical computing environment. The VTM Store Mode is the central purchasing and licensing hub where makers can expand their workstation capabilities. Whether you choose to start with the base app shell or unlock specialized AI, spatial vision, and robotics suites, every mode permanently binds to your account and synchronizes across all your devices.
Chapter 2 — Platform Features: All-in-One AI & Physical Computing Prototyping
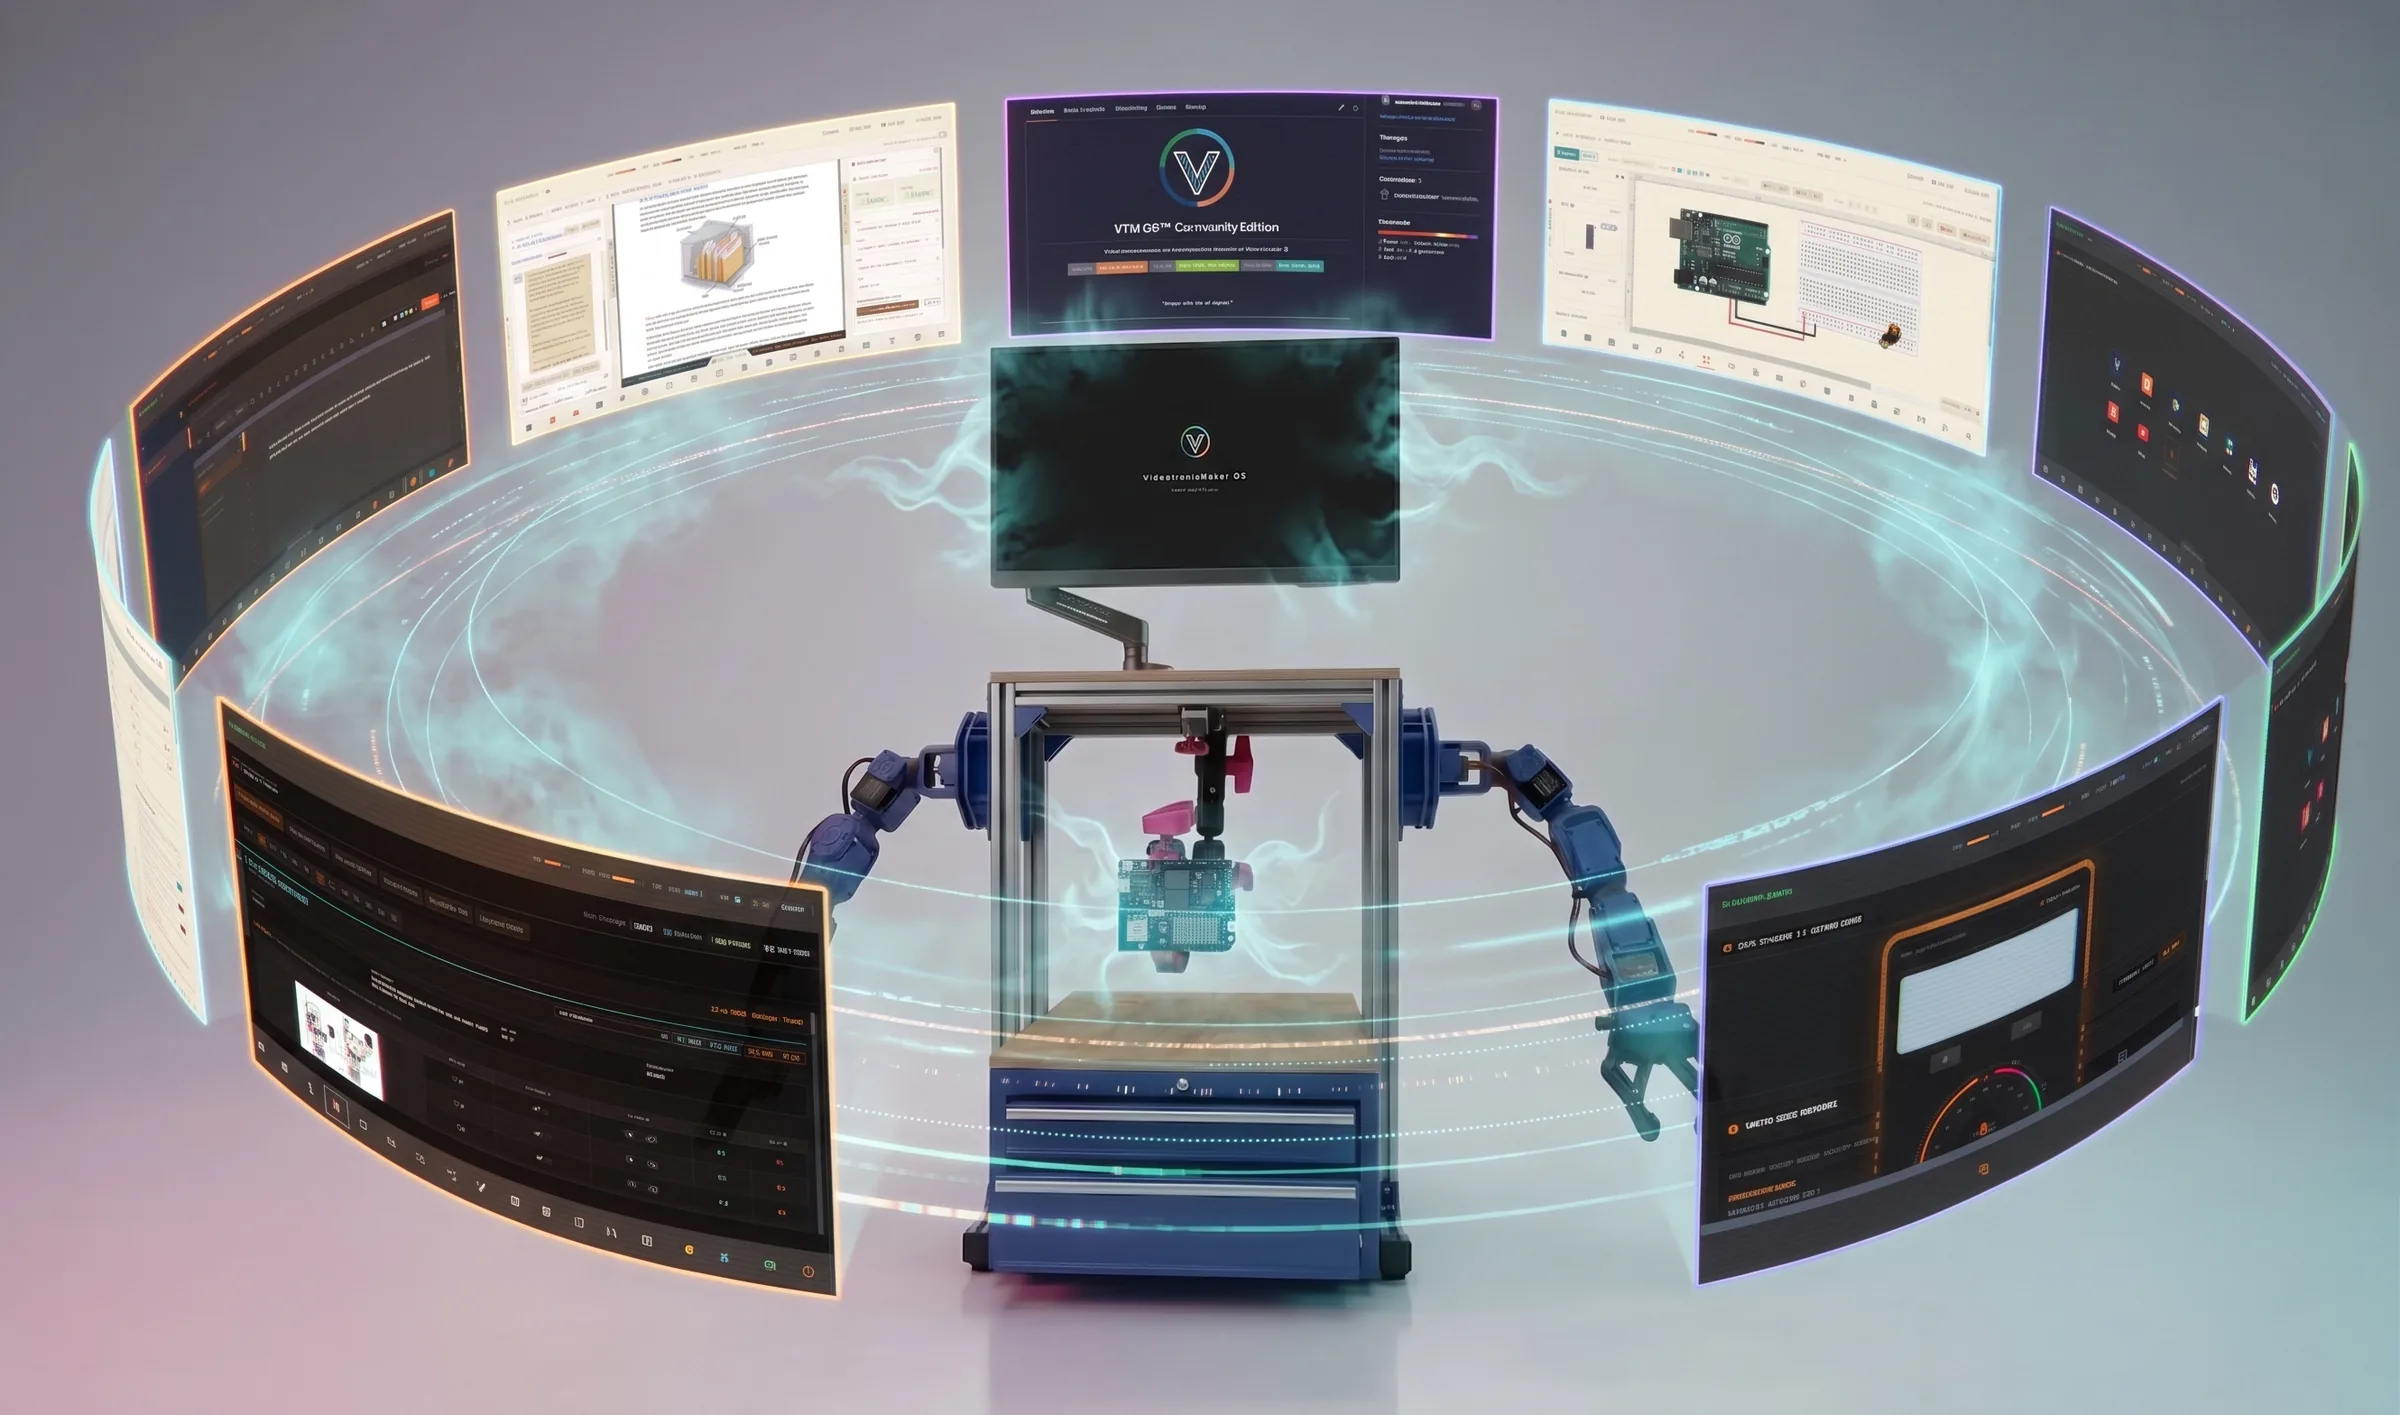
VTM Studio is a comprehensive prototyping platform for physical computing. It brings together everything you need to build, test, and iterate on projects combining artificial intelligence with physical hardware—all in one unified workspace. Instead of switching between separate tools for code editing, circuit layouts, serial monitoring, servo calibration, and AI assistance, VTM Studio integrates these environments. By combining local voice control, offline voice synthesis, visual camera tracking, physical serial hardware diagnostics, and prompt-driven UI orchestration, it provides a unified AI assistant experience for makers, students, and researchers alike.
AI & UI Orchestration
- Prompt-Driven Navigation: Open or close tabs, collapse sidebars, and switch views instantly using natural language or voice commands.
- Direct Code Writing: Ask the AI to write a program, and it will inject the code directly into the active IDE buffer.
- One-Click Injections: Load any AI-generated code block from the chat panel directly into the editor with a single click.
- State-Aware Prompting: The AI automatically receives real-time telemetry from your active dials, code, and views.
Physical & Hardware Link
- Multi-Axis Servo Control: Drive physical robotic arms and servos over USB serial with per-joint sliders, 1° scroll scrubbing, and two-way X-Panel mirroring.
- UART Bus Diagnostics: Monitor raw serial hex commands and calculate instruction checksums in real-time.
- Multichannel Telemetry: Stream ambient, kinetic, and orientation sensor data from mobile devices directly to your desktop.
- Arduino Integration: Compile and flash C++ sketches directly to your physical microcontrollers from the workstation.
Premium Workspace
- Offline Voice Hub: Crystal-clear, local speech synthesis and high-accuracy dictation operating 100% offline.
- Visual Studio Dark Theme: Professional, high-contrast syntax highlighting for the code and log editors.
- WYSIWYG Section 5:14 — Maker Log Mode: Document observations with rich text formatting, custom color codes, and database saves.
- Sortable Navigation: Drag-and-drop mode icons in the bottom bar with persistent layout saving.
Navigating Cloud AI Volatility: Multi-Provider Fallbacks & Developer Choice
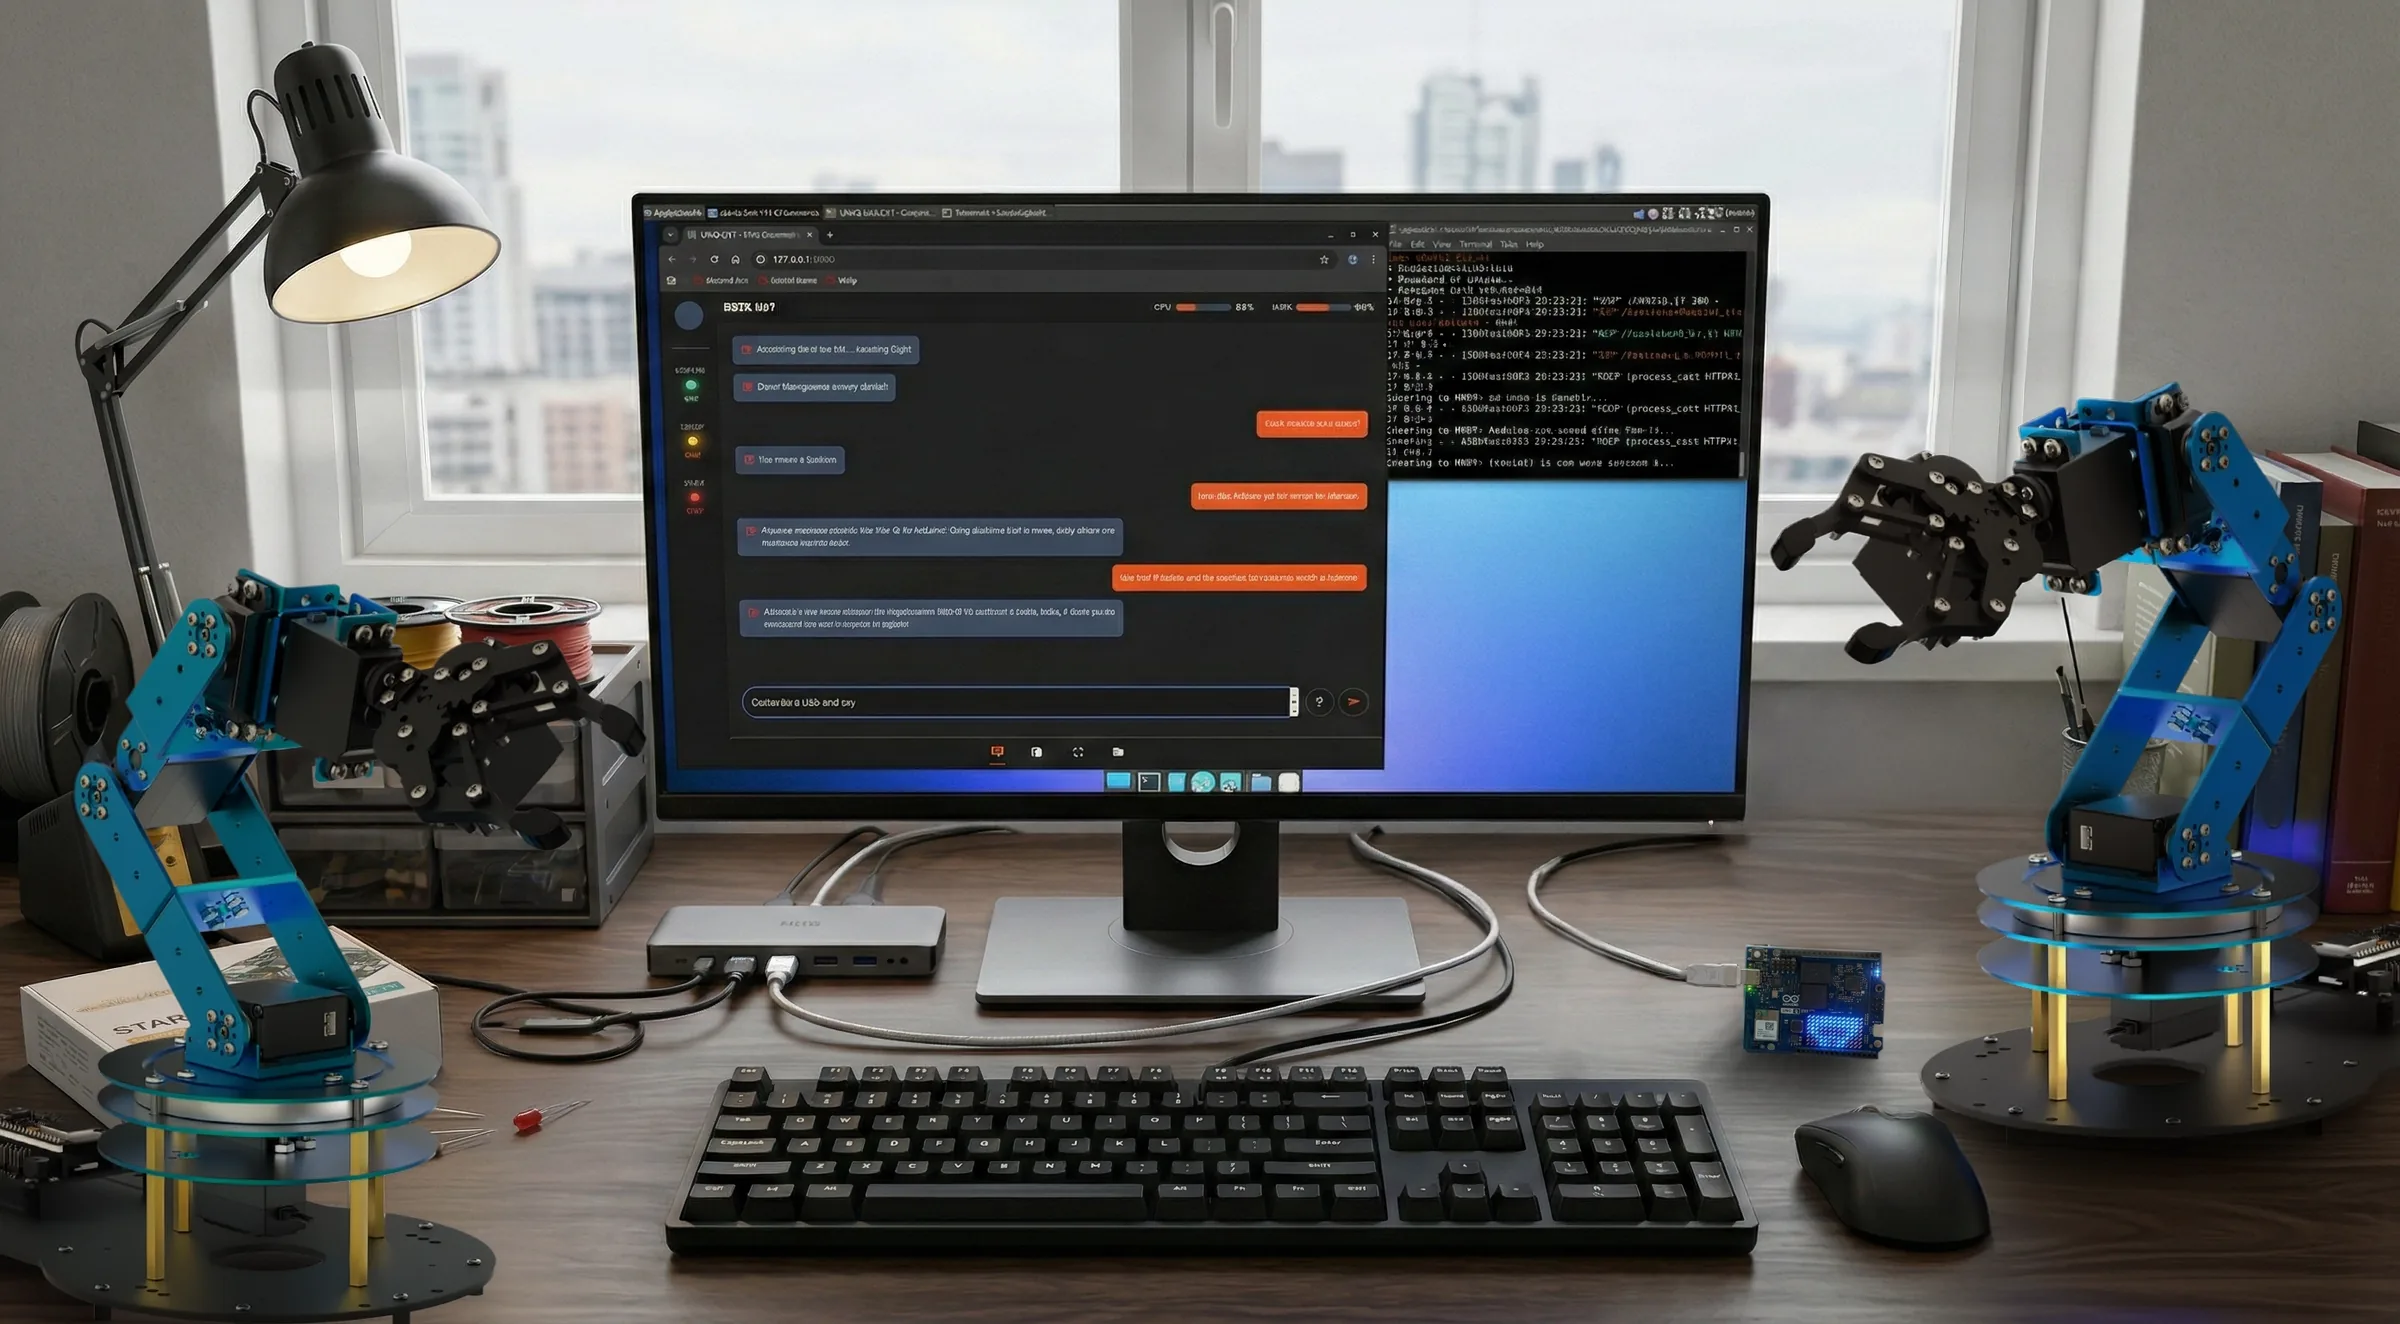
The cloud AI landscape moves quickly. Developer tiers change, rate limits adjust, and vendor terms shift. While VTM Studio requires no ongoing software subscription fees, relying on external cloud intelligence always carries inherent dependency on third-party API availability.
To help mitigate this risk, VTM Studio integrates a flexible multi-engine routing architecture. Rather than locking your workflow to a single proprietary cloud vendor, the studio provides built-in fallback options across multiple providers offering free-tier API access:
- Google Gemini: High-reasoning frontier inference.
- Groq: High-speed LPU inference hosting open-weights architectures such as Qwen.
Practical Mitigation, Not a Guarantee: Having multiple providers gives you an immediate operational fallback if one provider experiences downtime, throttles requests, or modifies their free-tier policies. However, this is a mitigation strategy, not a failsafe plan. If third-party cloud providers reduce or discontinue their free offerings in the future, cloud inference features will require standard user-supplied API credits or fallback to local on-device models.
By combining cloud API fallbacks with local edge inference (via Model Forge), VTM Studio gives you practical alternatives to keep working as the surrounding cloud landscape evolves.
Section 2:2 — Standard Maker Workflow & Mode Ordering
VTM Studio provides a sortable navigation menu at the bottom of the workbench. By default, the active modes are organized sequentially to reflect a logical, multi-phase prototyping workflow.
| Seq | Mode Name | Purpose |
|---|---|---|
| 01 | Chat Mode | AI Ideation & System Command |
| 02 | Mag Mode | Platform Guide & Interactive Publication |
| 03 | Study Mode | Fundamental Academic Research & Theory |
| 04 | Reference Mode | Engineering Calculators & Pinout References |
| 05 | Spec Mode | Datasheet Specifications & Custom Library |
| 06 | Layout Mode | Circuit Diagram & Wiring Layout Design |
| 07 | Code Mode | Software Development & Firmware Flash |
| 08 | Model Forge Mode | Local AI Model Quantization & Compilation |
| 09 | Arm Control Mode | Direct USB Serial Multi-Axis Servo Control |
| 10 | Meter Mode | Hardware Electrical Diagnostics & Multimeter |
| 11 | Science Mode | Sensor Data Logging & Telemetry Calibration |
| 12 | Vision Mode | Spatial AI Computer Vision & Camera Sensing |
| 13 | Audio Mode | Voice Agent Speech-to-Text & Audio Analysis |
| 14 | Mixer Mode | Audio Gain Processing & Signal Normalization |
| 15 | Image Mode | Bézier Vector Tracing & Component Cutout Studio |
| 16 | Converter Mode | Asset Format Conversion & Optimization |
| 17 | Log Mode | Mission Journal & Lab State Saving |
| 18 | Favorites Mode | Master Dashboard & Quick Launch Shortcuts |
| 19 | Fitness Mode (Coming Soon) | Ergonomic & Biomechanical Lab Health Tracking (Expansion Pack) |
| 20 | Music Mode | Workplace Focus Ambience & Flow State Audio |
Chapter 3 — AI-Powered Workspace Control
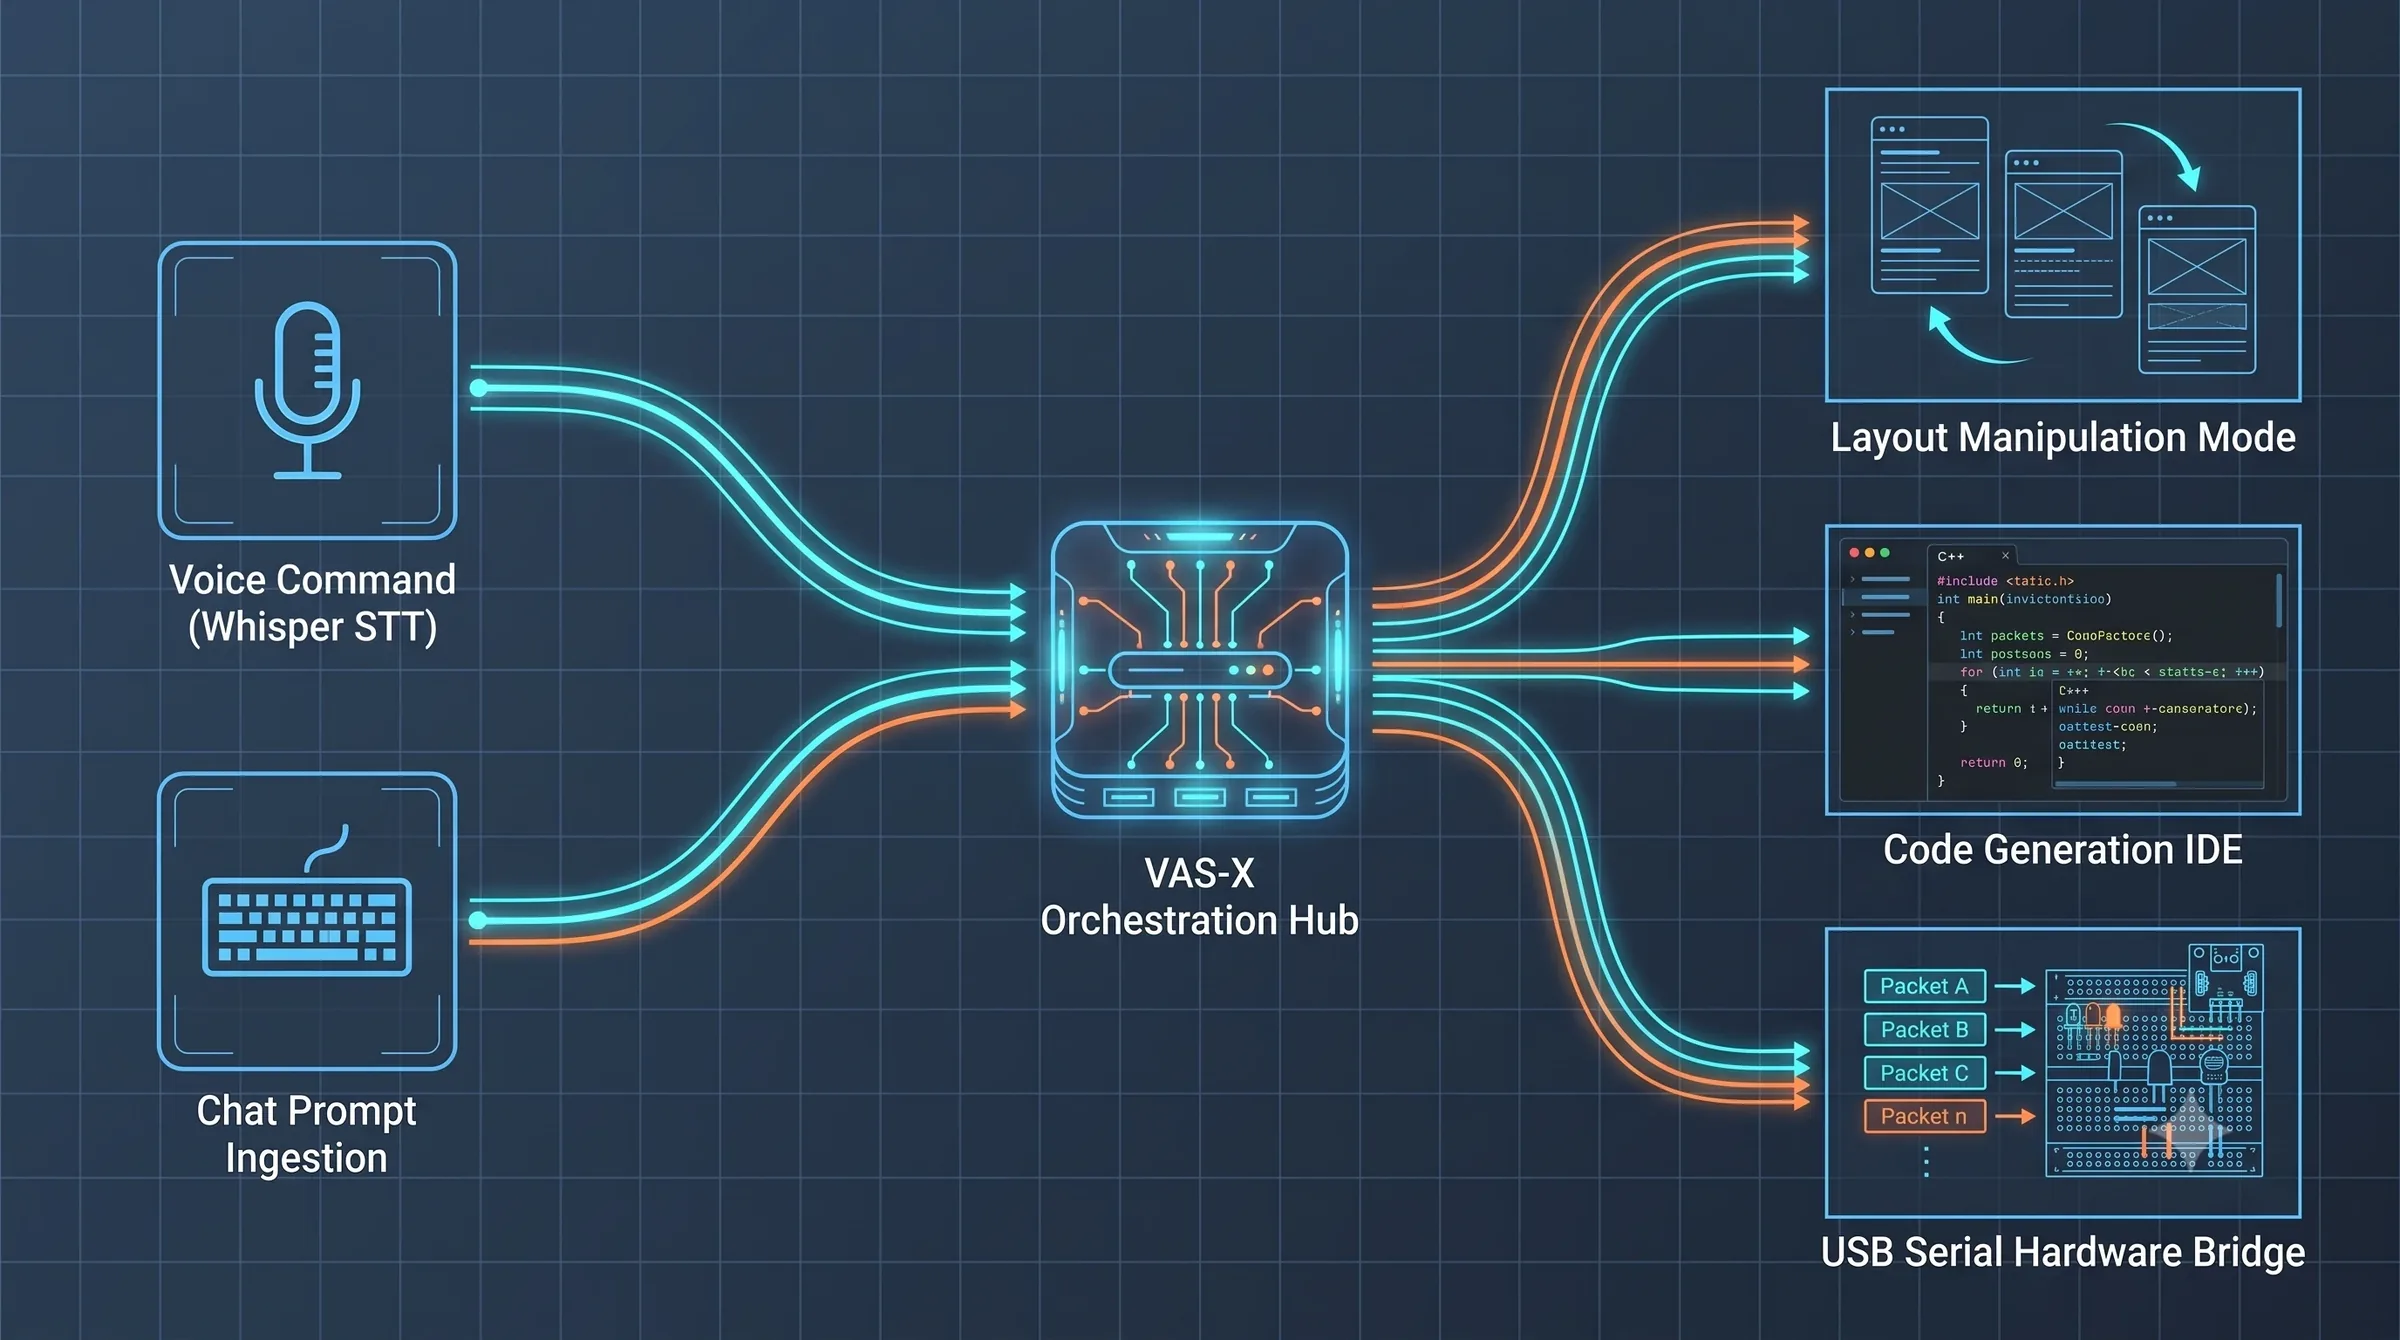
VTM Studio features a deeply integrated AI orchestration system that allows you to control much of the prototyping environment using natural language or voice commands. Instead of manually clicking through menus, you can speak to VAS-X to navigate the UI, write code, and automate actions.
Section 3:1 — Voice & Prompt UI Navigation
Hands-free interface navigation works with VAS-X and the Google Gemini API. Simply speak into your microphone or type a command into VAS-X:
- View Switching: Say "go to code mode" or "navigate to the science lab" to switch the active workspace.
- Tab & Sidebar Control: Ask VAS-X to "close the x-panel" or "open the instructions drawer", and the interface immediately adjusts.
- Provider Note: Automated interface navigation is supported when using VAS-X with the Gemini API. When using other cloud models or local edge models, standard conversational chat remains available.
Zero-Cost Multi-Engine Pipeline: Choice & Automatic Fallback
To protect makers and students from workstation interruptions and provide total flexibility, VTM Studio incorporates an automated Zero-Cost Multi-Engine Pipeline. This pipeline serves two key purposes: giving you direct model selection control, and providing automatic fallback if an API provider experiences rate limits or outages.
           ┌─────────────────────────────────────────┐
           │          USER INPUT / COMMAND           │
           └────────────────────┬────────────────────┘
                                │
             [User Model Selection OR Auto-Fallback]
                                │
               ┌────────────────────┴────────────────────┐
               │                                         │
               ▼                                         ▼
┌─────────────────────────────┐   ┌─────────────────────────────┐
│    ENGINE A: Gemini Free    │   │    ENGINE B: Groq LPU       │
│  (High-Reasoning Cloud)     │   │ (Qwen 2.5 / 3.6 / 3.8 Fast) │
└──────────────┬──────────────┘   └──────────────┬──────────────┘
               │                                 │
   [HTTP 429 / Rate Limit?]          [HTTP 429 / Rate Limit?]
               │                                 │
               └────────────────────┬────────────────────┘
                                │
                                ▼
                ┌──────────────────────────────┐
                │  Automatic Silent Failover   │
                └──────────────┬───────────────┘
                                │
                                ▼
                ┌──────────────────────────────┐
                │       Render Response        │
                └──────────────────────────────┘
Key Technical Capabilities:
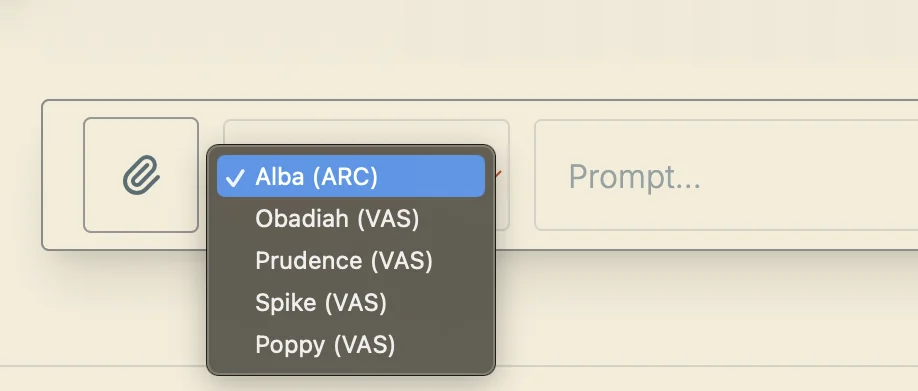
- Developer Model Selection: Switch models on-the-fly directly from the UI dropdown whenever you want a different model architecture, speed, or reasoning style for your prompt.
- Automatic HTTP 429 & Quota Failover: The runtime continuously monitors API HTTP response headers. If the primary endpoint returns a rate limit or connection degradation, VTM Studio automatically fails over to the secondary endpoint mid-session without dropping state or interrupting hardware telemetry.
- Ultra-Low Latency Inference: Powered by Groq's custom LPU (Language Processing Unit) hardware, queries run at extreme generation speeds—ideal for real-time serial telemetry monitoring, circuit diagnostics, and interactive hardware debugging.
- State Preservation: System prompts, active mode context, and conversation history are automatically reformatted and preserved across engine switches.
Section 3:2 — AI Code Writing & IDE Integration
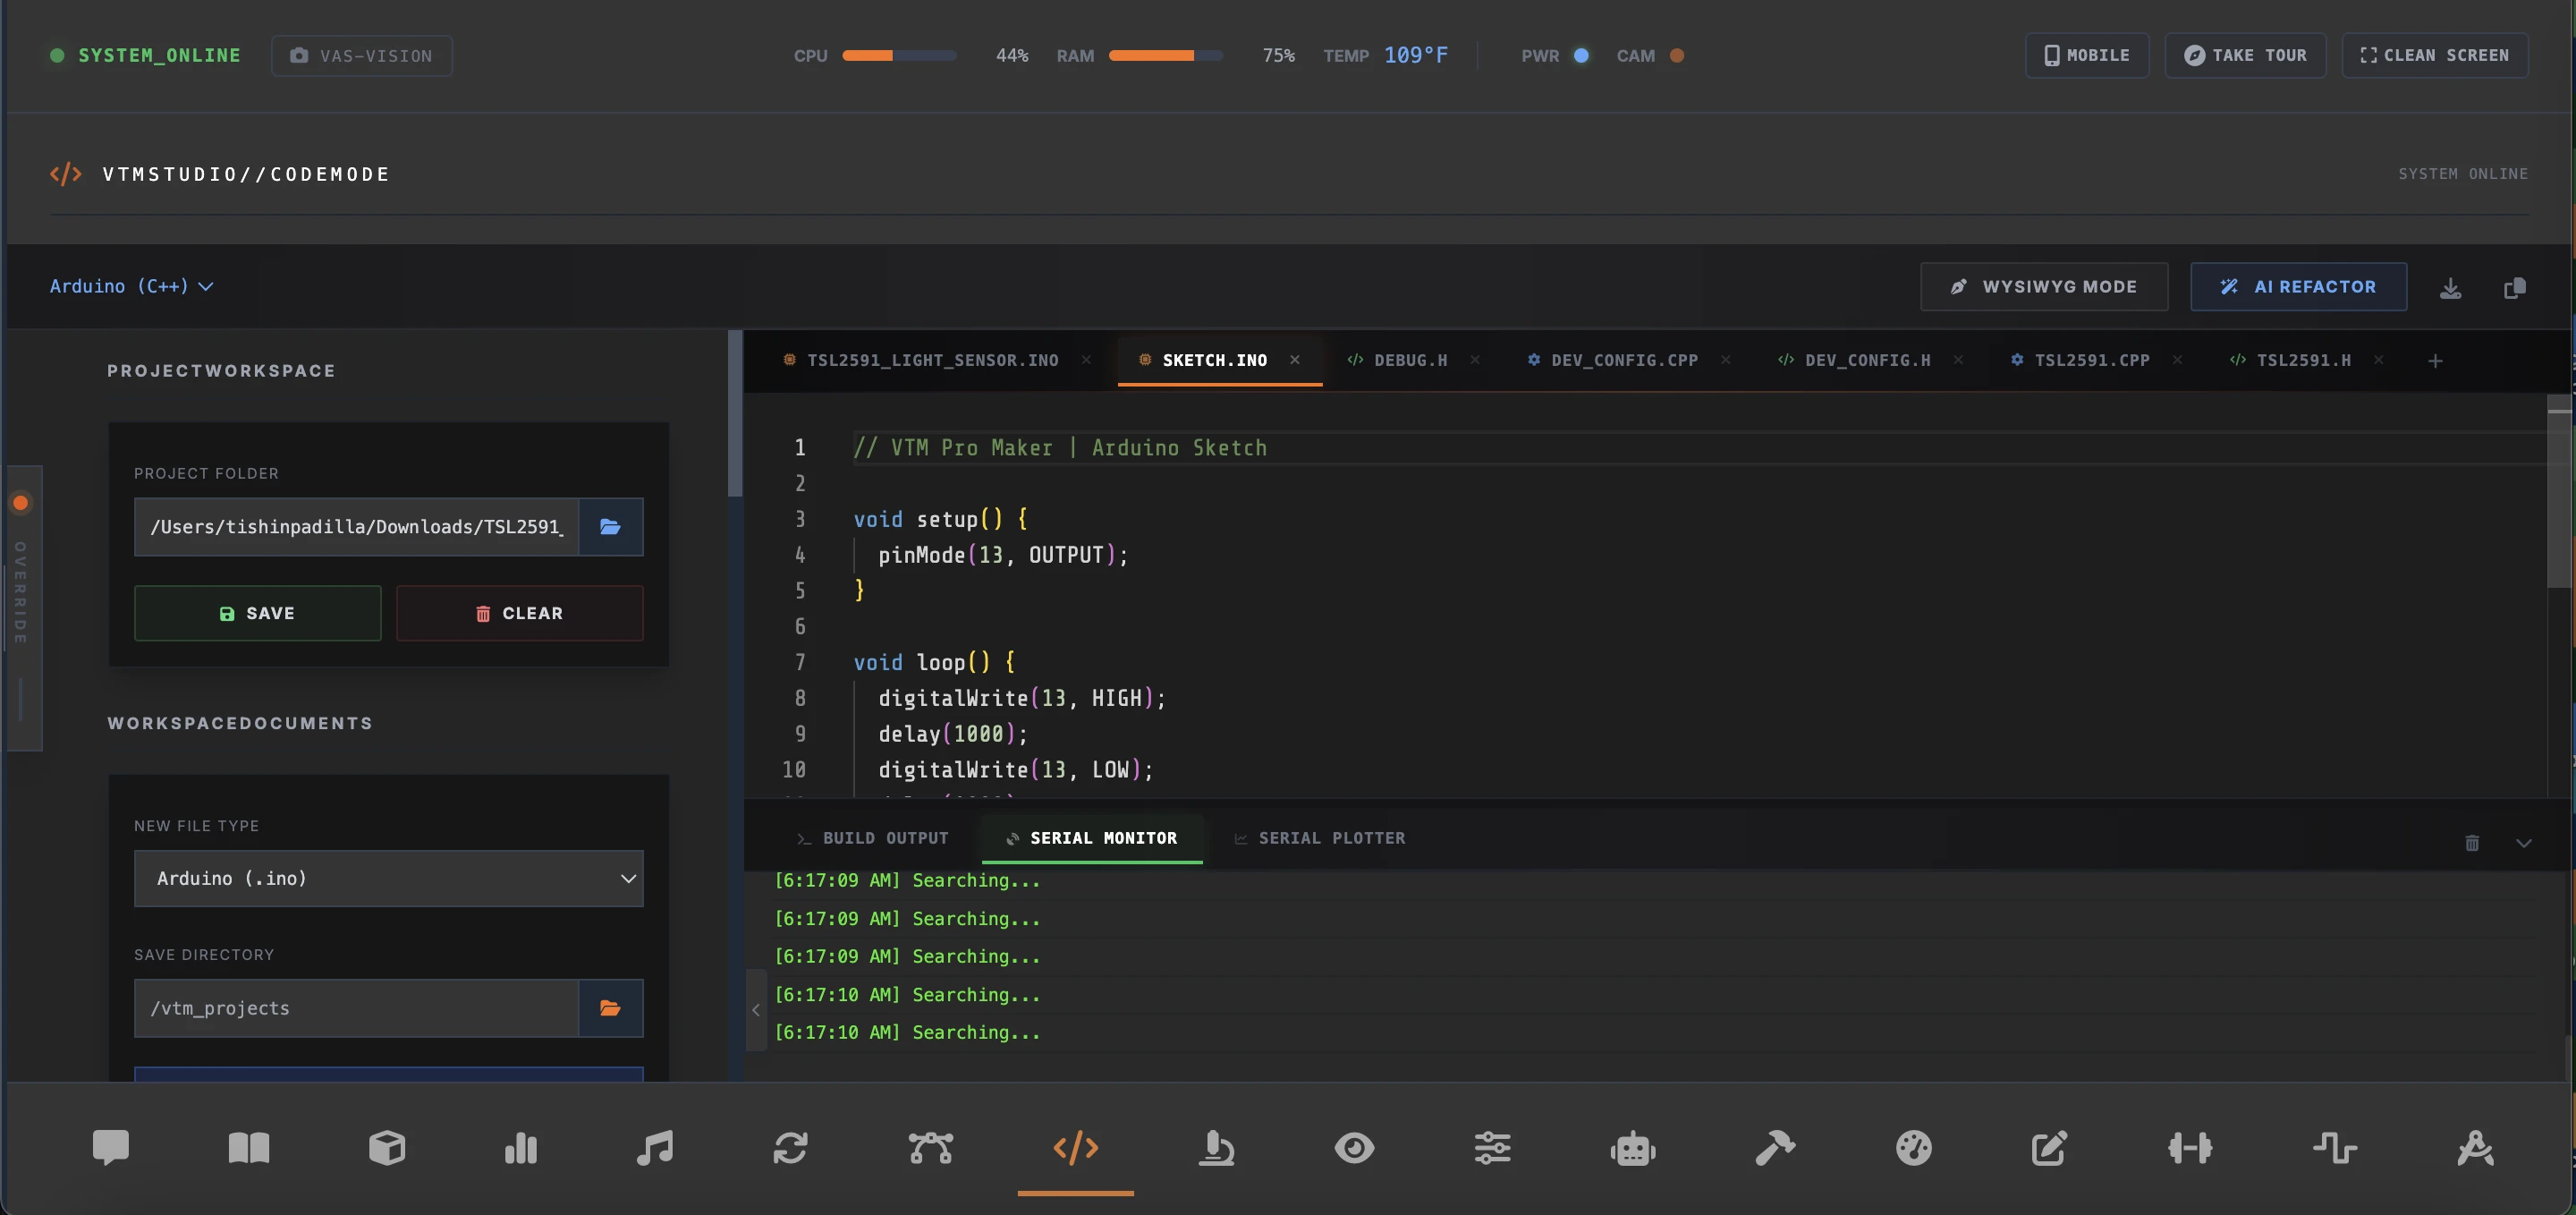
VTM Studio connects AI code generation and your physical editor, allowing you to go from a prompt to running code on hardware:
- Direct Code Injection: You can ask the AI to write a program (e.g., "write a sketch for an LED array with 4 LEDs. Red, blue, green and yellow"). The AI will generate the code and automatically inject it directly into the Section 5:12 — Code Mode IDE.
- "Load into Editor" Button: Every code block rendered in the chat interface features an interactive button. Clicking it instantly copies the snippet and loads it into your active editor buffer.
- State-Aware Code Editing: When you ask the AI to comment, edit, or debug your code, it automatically receives the full context of your active editor file, ensuring highly accurate modifications.
Section 3:3 — Microcontroller Compilation & Flashing
Once your code is loaded into the IDE, you can compile and flash it directly to your physical hardware over USB serial:
- MicroPython Live Execution: For MicroPython-compatible boards (such as the Raspberry Pi Pico, ESP32, or Nano RP2040 Connect), write your Python script and click Run Live to execute it directly on the board.
- C/C++ Compilation & First-Compile Setup (~45–90s One-Time):
If Arduino IDE 2.x is already installed on macOS or Windows, VTM Studio detects its toolchain and compiles immediately (~1–2s). Otherwise, clicking Compile opens the First-Time Board Compiler Setup modal to download the GPLv3 compiler core (such as
arduino:avrcovering Uno, Nano, Mega, Leonardo, and Pro Mini) on demand into~/.arduino15/(~45–90s one-time setup); all subsequent builds finish in ~1–2s offline. - USB Serial Discovery & Arduino UNO Q Rules: Scans official and CH340/CP210x/FTDI USB serial ports automatically. On Arduino UNO Q, the onboard STM32U585 flashes offline via internal SWD (use
LED_BUILTINfor the green user LED;D13is externalSPI2_SCK), external USB boards connect via a powered USB-C PD hub (5V / 3A) onJUSB1, reserved MPU UARTs (/dev/ttyMSM0,/dev/ttyHS0) are excluded, and analog inputsA0/A1are3.3Vmax.
Chapter 4 — The Fundamental Philosophy: Two Parts, One Unified System
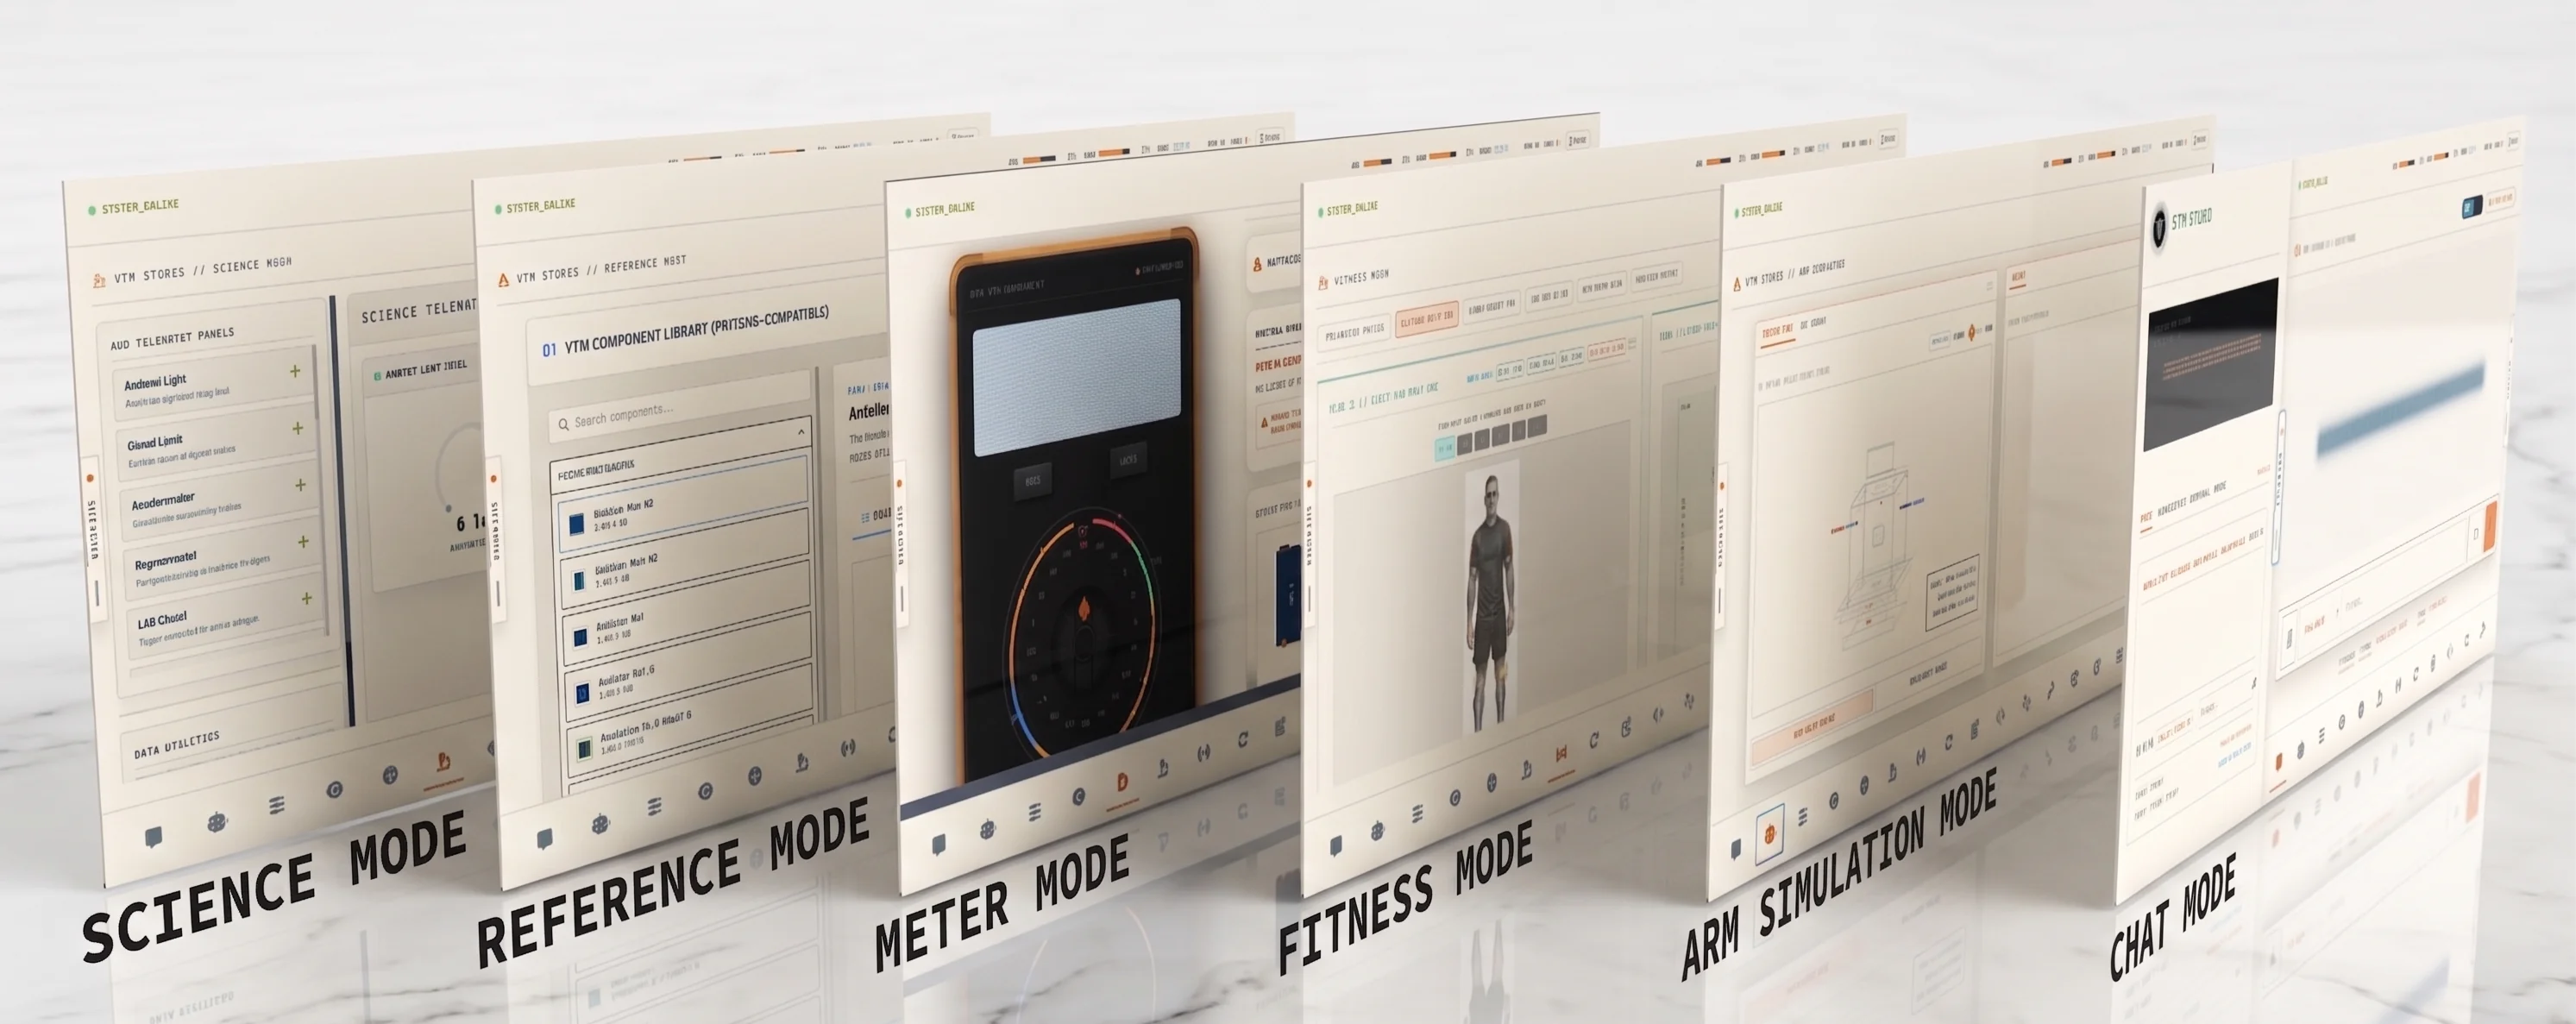
To navigate the system successfully, it helps to understand how the workbench is organized into two complementary layers—starting with the software on your computer and leading to whatever physical build you choose to create:
"Coders have a studio. Artists have a studio. Now makers have a studio." VTM Studio (Version 2.2) is a cross-platform desktop software workstation for macOS, Windows, Linux Desktop, Raspberry Pi, and Arduino UNO Q. It was built to bring the many parts of a physical computing project—research, circuit math, wiring layouts, code, AI assistance, hardware control, and build logs—into one unified environment so you can build without friction or a monthly subscription.
How This Studio Came Together: As I learned physical computing and used different apps, software, and hardware tools, I learned the real workflow it takes to go from an idea to a working build—studying textbooks and datasheets, calculating resistor and power values, planning breadboard wiring, writing and flashing code, testing servos and sensors, and logging what worked. When AI came out, I was able to put all of those tools together in one place, so I did:
- Connected Modes in One Workspace: Move smoothly from reading engineering textbooks (Study Mode), calculating resistor and power values (Reference Mode), inspecting custom component pinouts (Spec Mode), and laying out 2D breadboard wiring (Layout Mode) to compiling and flashing code (Code Mode), driving multi-axis servos over USB serial (Arm Control Mode), probing circuits (Meter Mode), plotting live sensors (Science Mode), tracking camera targets (Vision Mode), and recording your progress (Log Mode).
- Three Purpose-Built In-App AI Personas: Work alongside ARC (Main Chat for code generation, math, and ideation), VAS-X (content-aware sidebar assistant that sees your active mode, analyzes workspace snapshots via VAS Vision, and supports hands-free navigation with the Gemini API), and ARC T – A (your Study Mode textbook tutor).
- Hybrid Cloud & Local Edge AI: Pair cloud reasoning (Google Gemini and Groq) with private, offline on-device models—including Model Forge, a 3-tab studio to convert local Hugging Face
.safetensorsweights to.gguf, quantize them to 4-bit or 8-bit, and hot-swap local models live on your CPU. - Works With the Hardware You Already Own: You do not need proprietary hardware to use VTM Studio. It connects directly to standard microcontrollers, single-board computers, servos, sensors, and cameras already on your desk.
Start with the software on your computer, learn step-by-step alongside built-in AI assistants, and let it lead to your own physical build of whatever you can imagine.
Section 4:2 — The P³™ Platform (The Physical Build Layer)
When the AI boom started, people immediately started thinking about Jarvis. For the first time ever, everyday people were talking about building their own Jarvis. It started with AI chats on a screen. Now robots are being sold, and the Jarvis dream has moved toward a Vision reality—we can now build a machine with both AI intelligence and a physical body. That is what we want to make, and that is where this started.
Yet a robot torso is only one path. Now that we have agentic AI, makers, computer science pros, and students are building—or planning to build—all kinds of physical projects. VTM Studio is made for this. With AI, we can build physical hardware at a much faster pace. Not long ago, figuring out the code, knowing which electronic parts were needed, calculating the circuits, and learning every discipline from scratch was daunting. Now it is not—it is finally within reach.
Build a robot. Program the arms. Utilize AI vision. Create a new workbench where you prototype, document, and publish your work, or prepare community tutorials—all right from here. This is where the physical and the neural come together. The P³™ (Physical Prototyping Platform) serves that exact purpose: use my concept images for inspiration, or build whatever you want. Build a custom command center and workstation console, or build one of my concept ideas below:
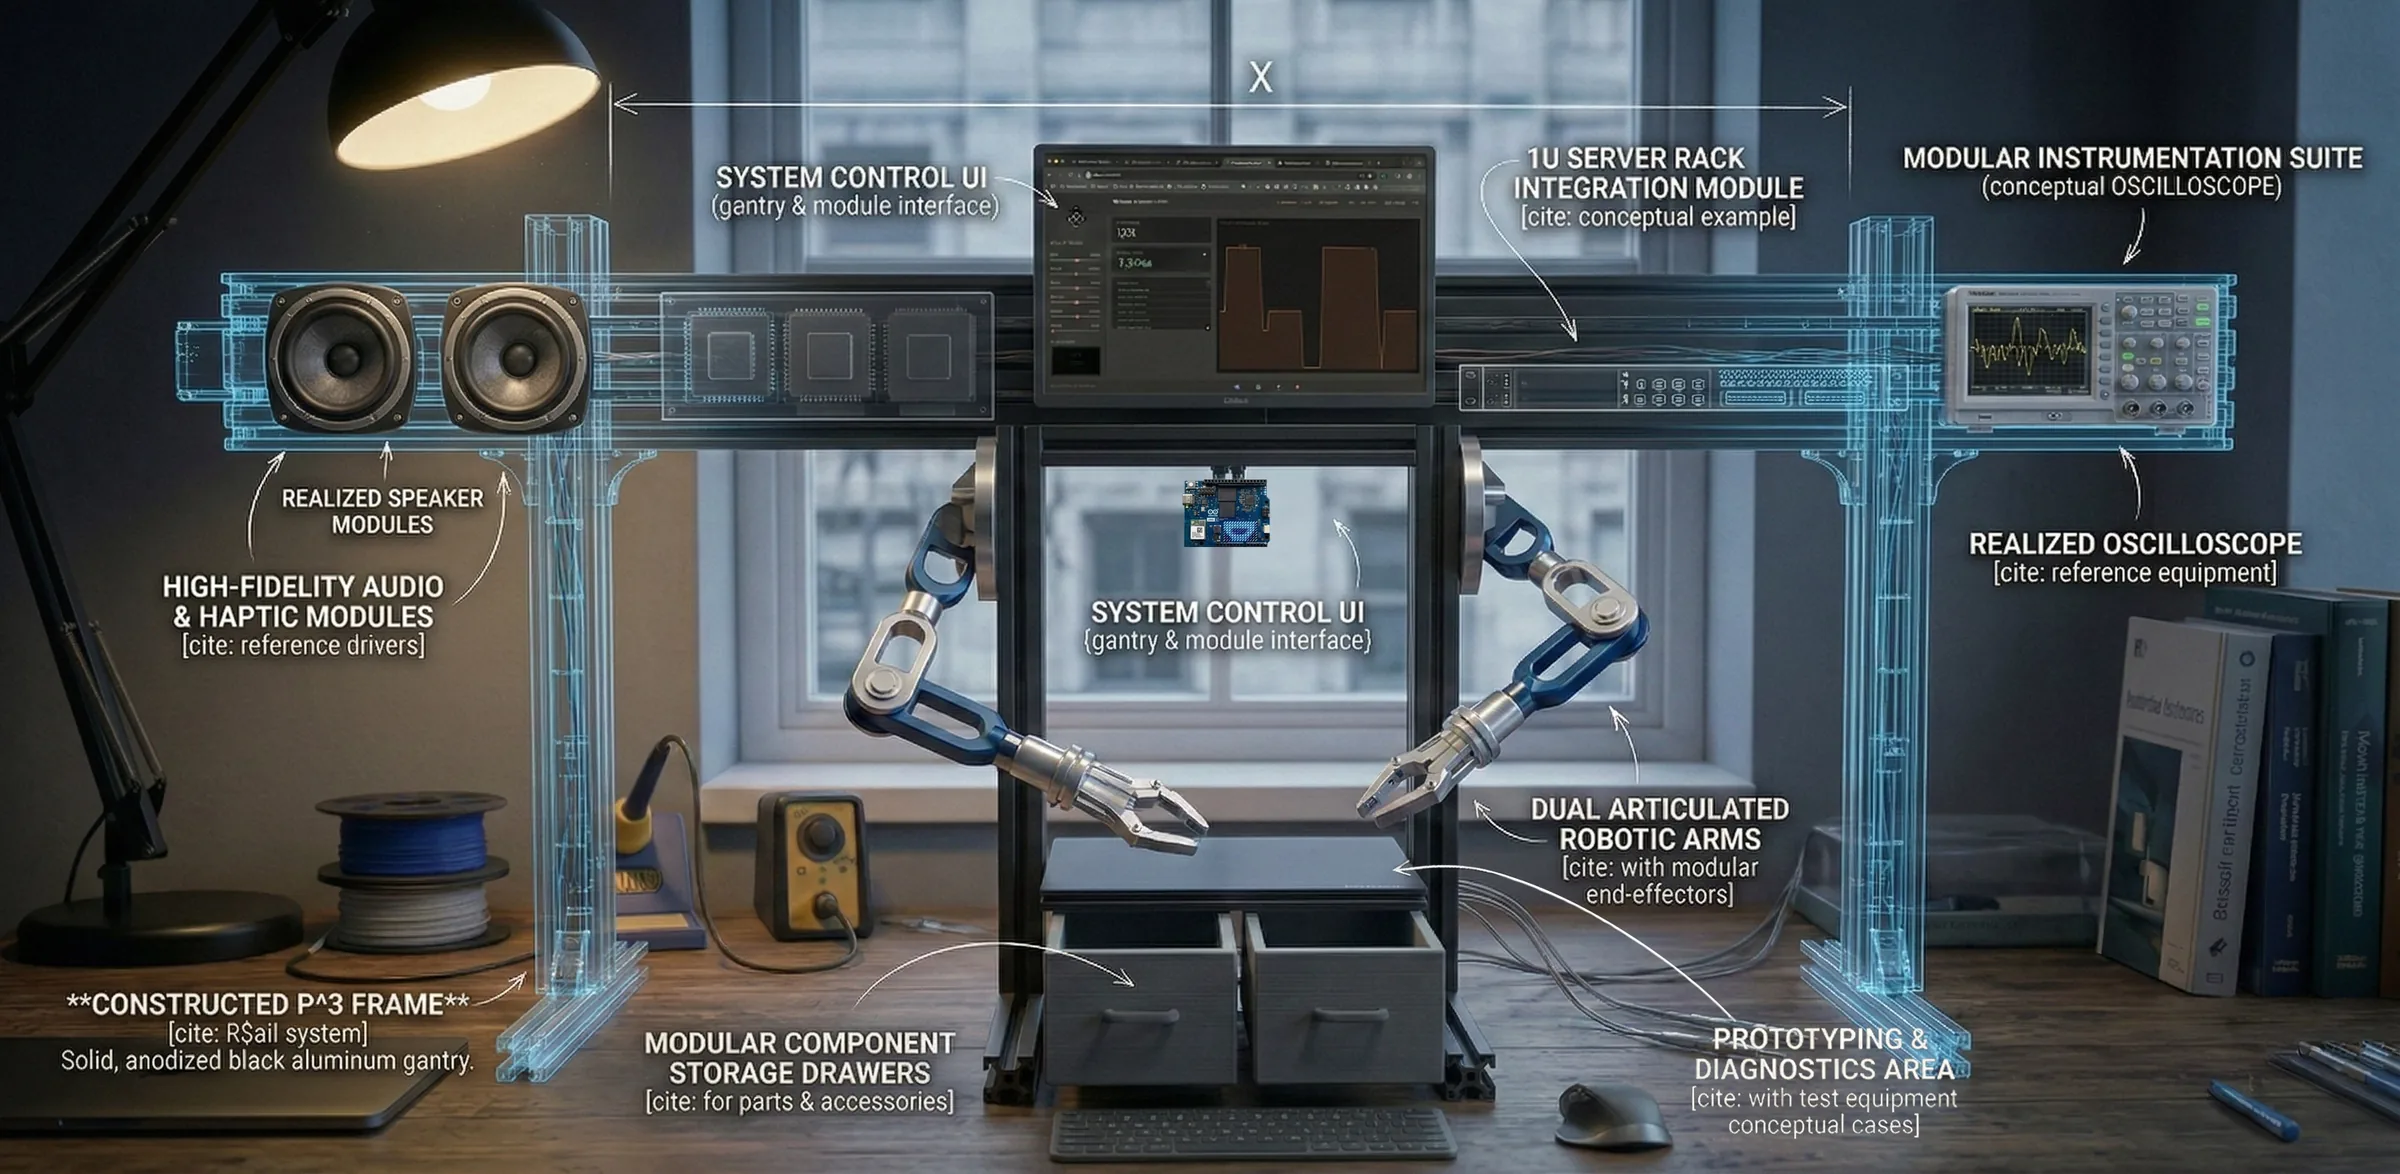
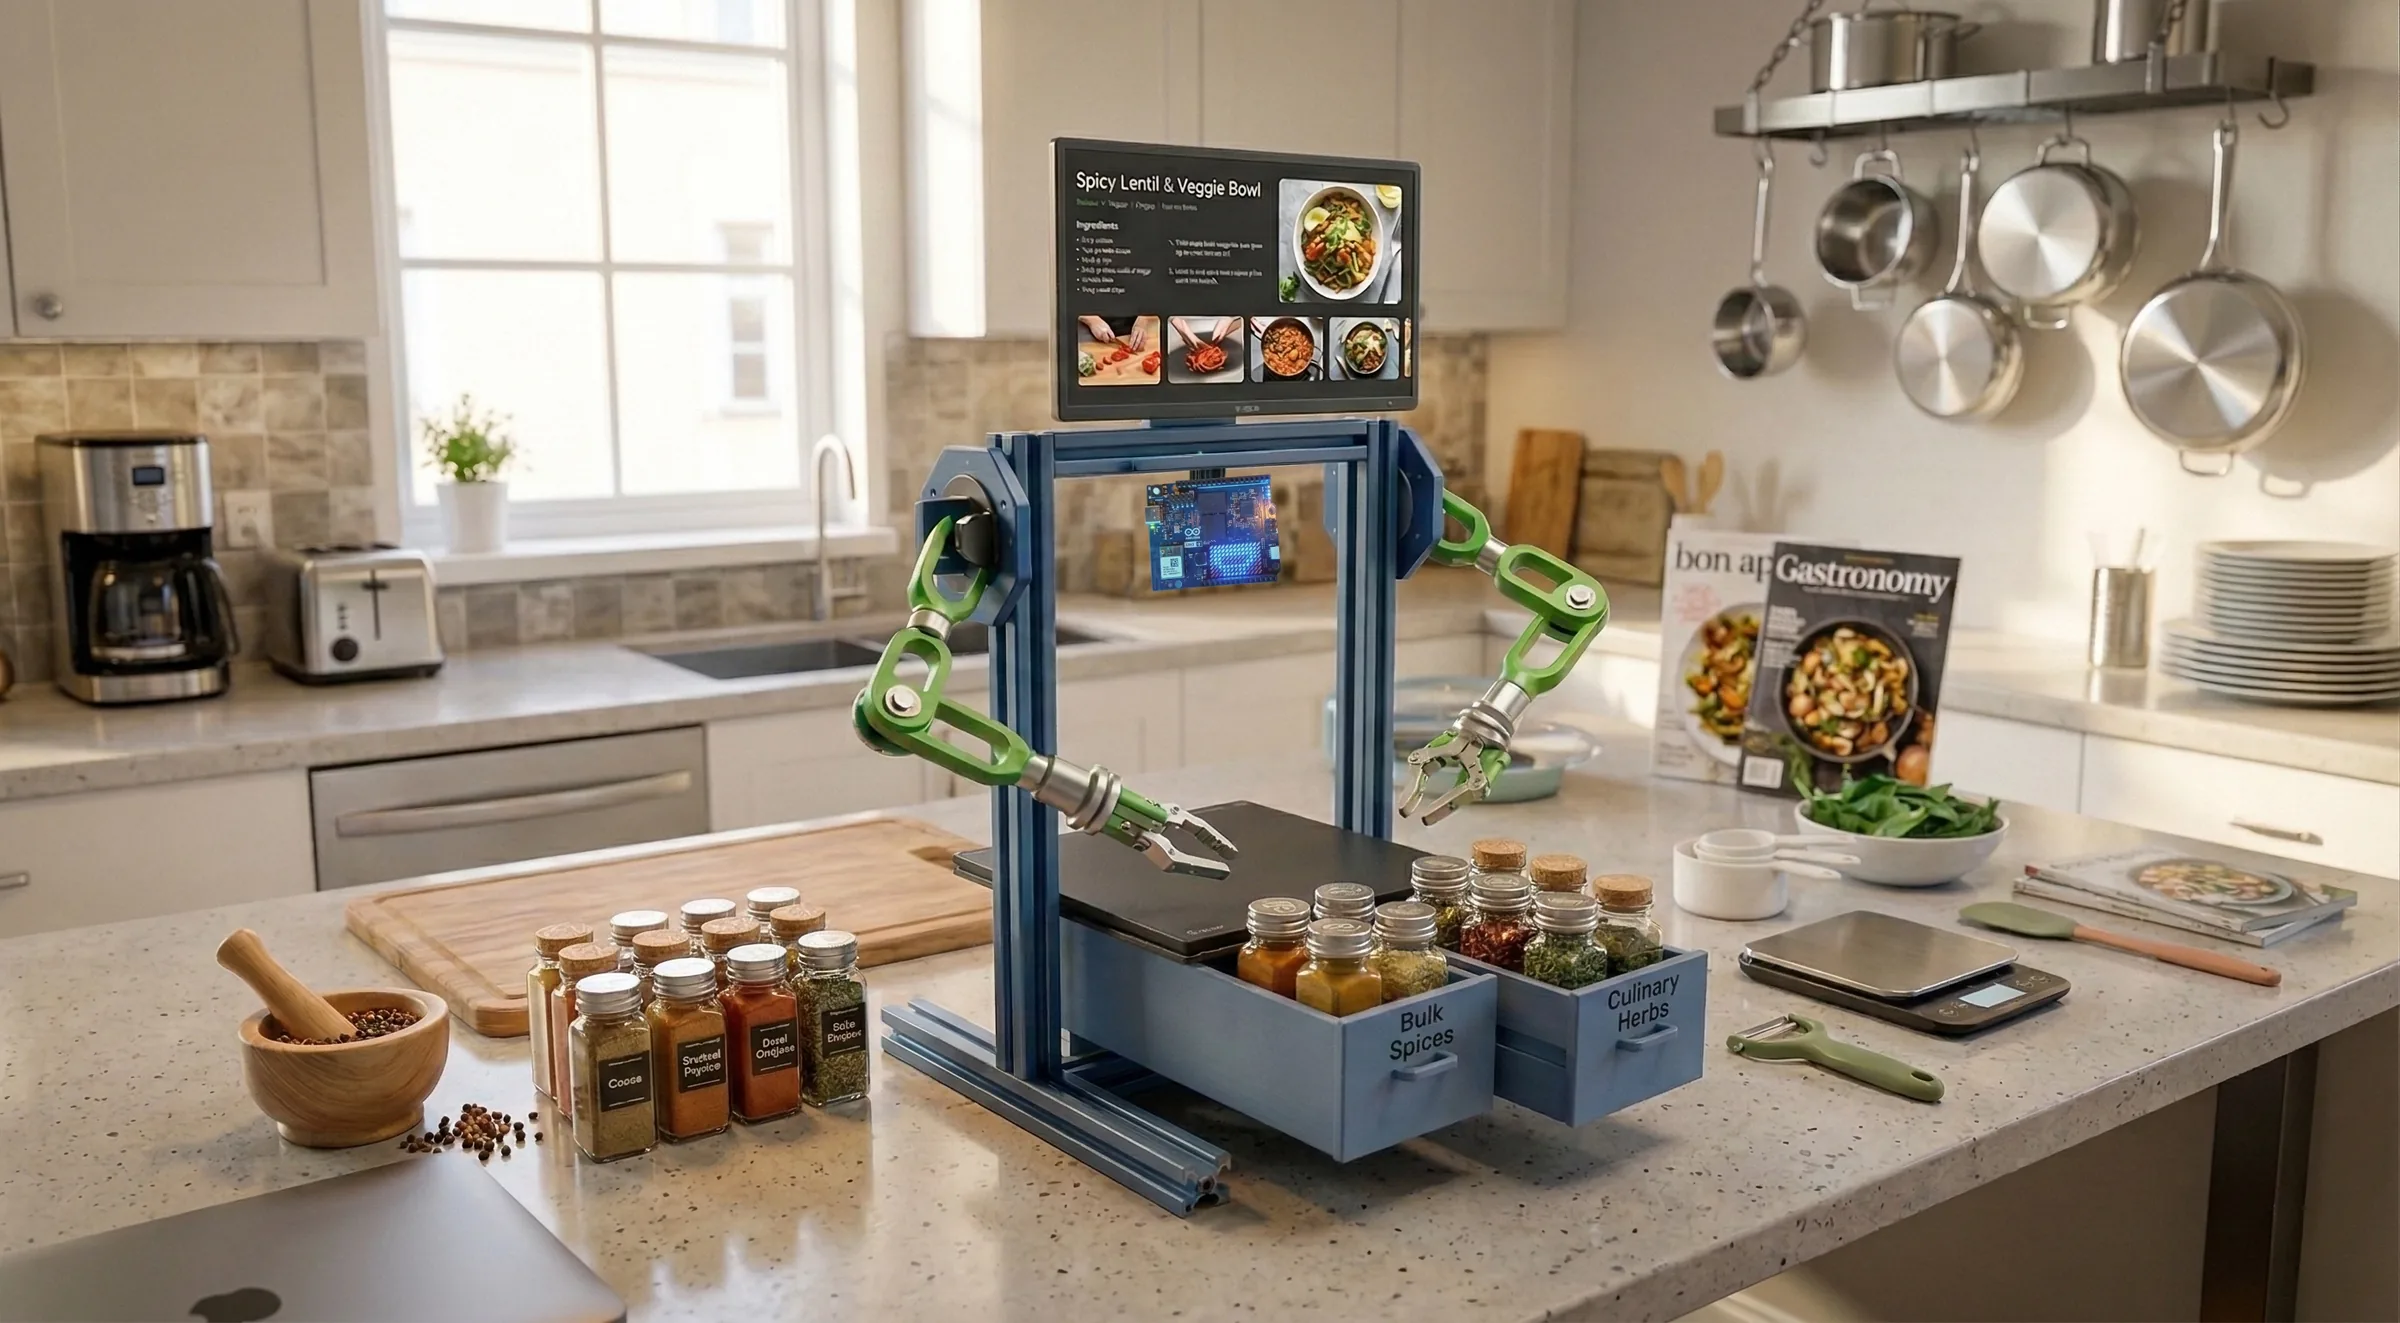
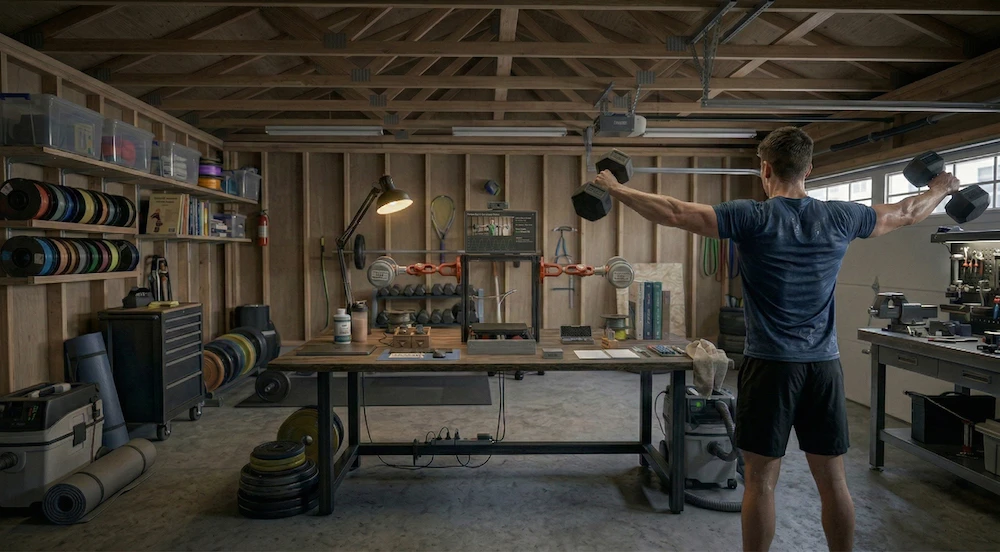
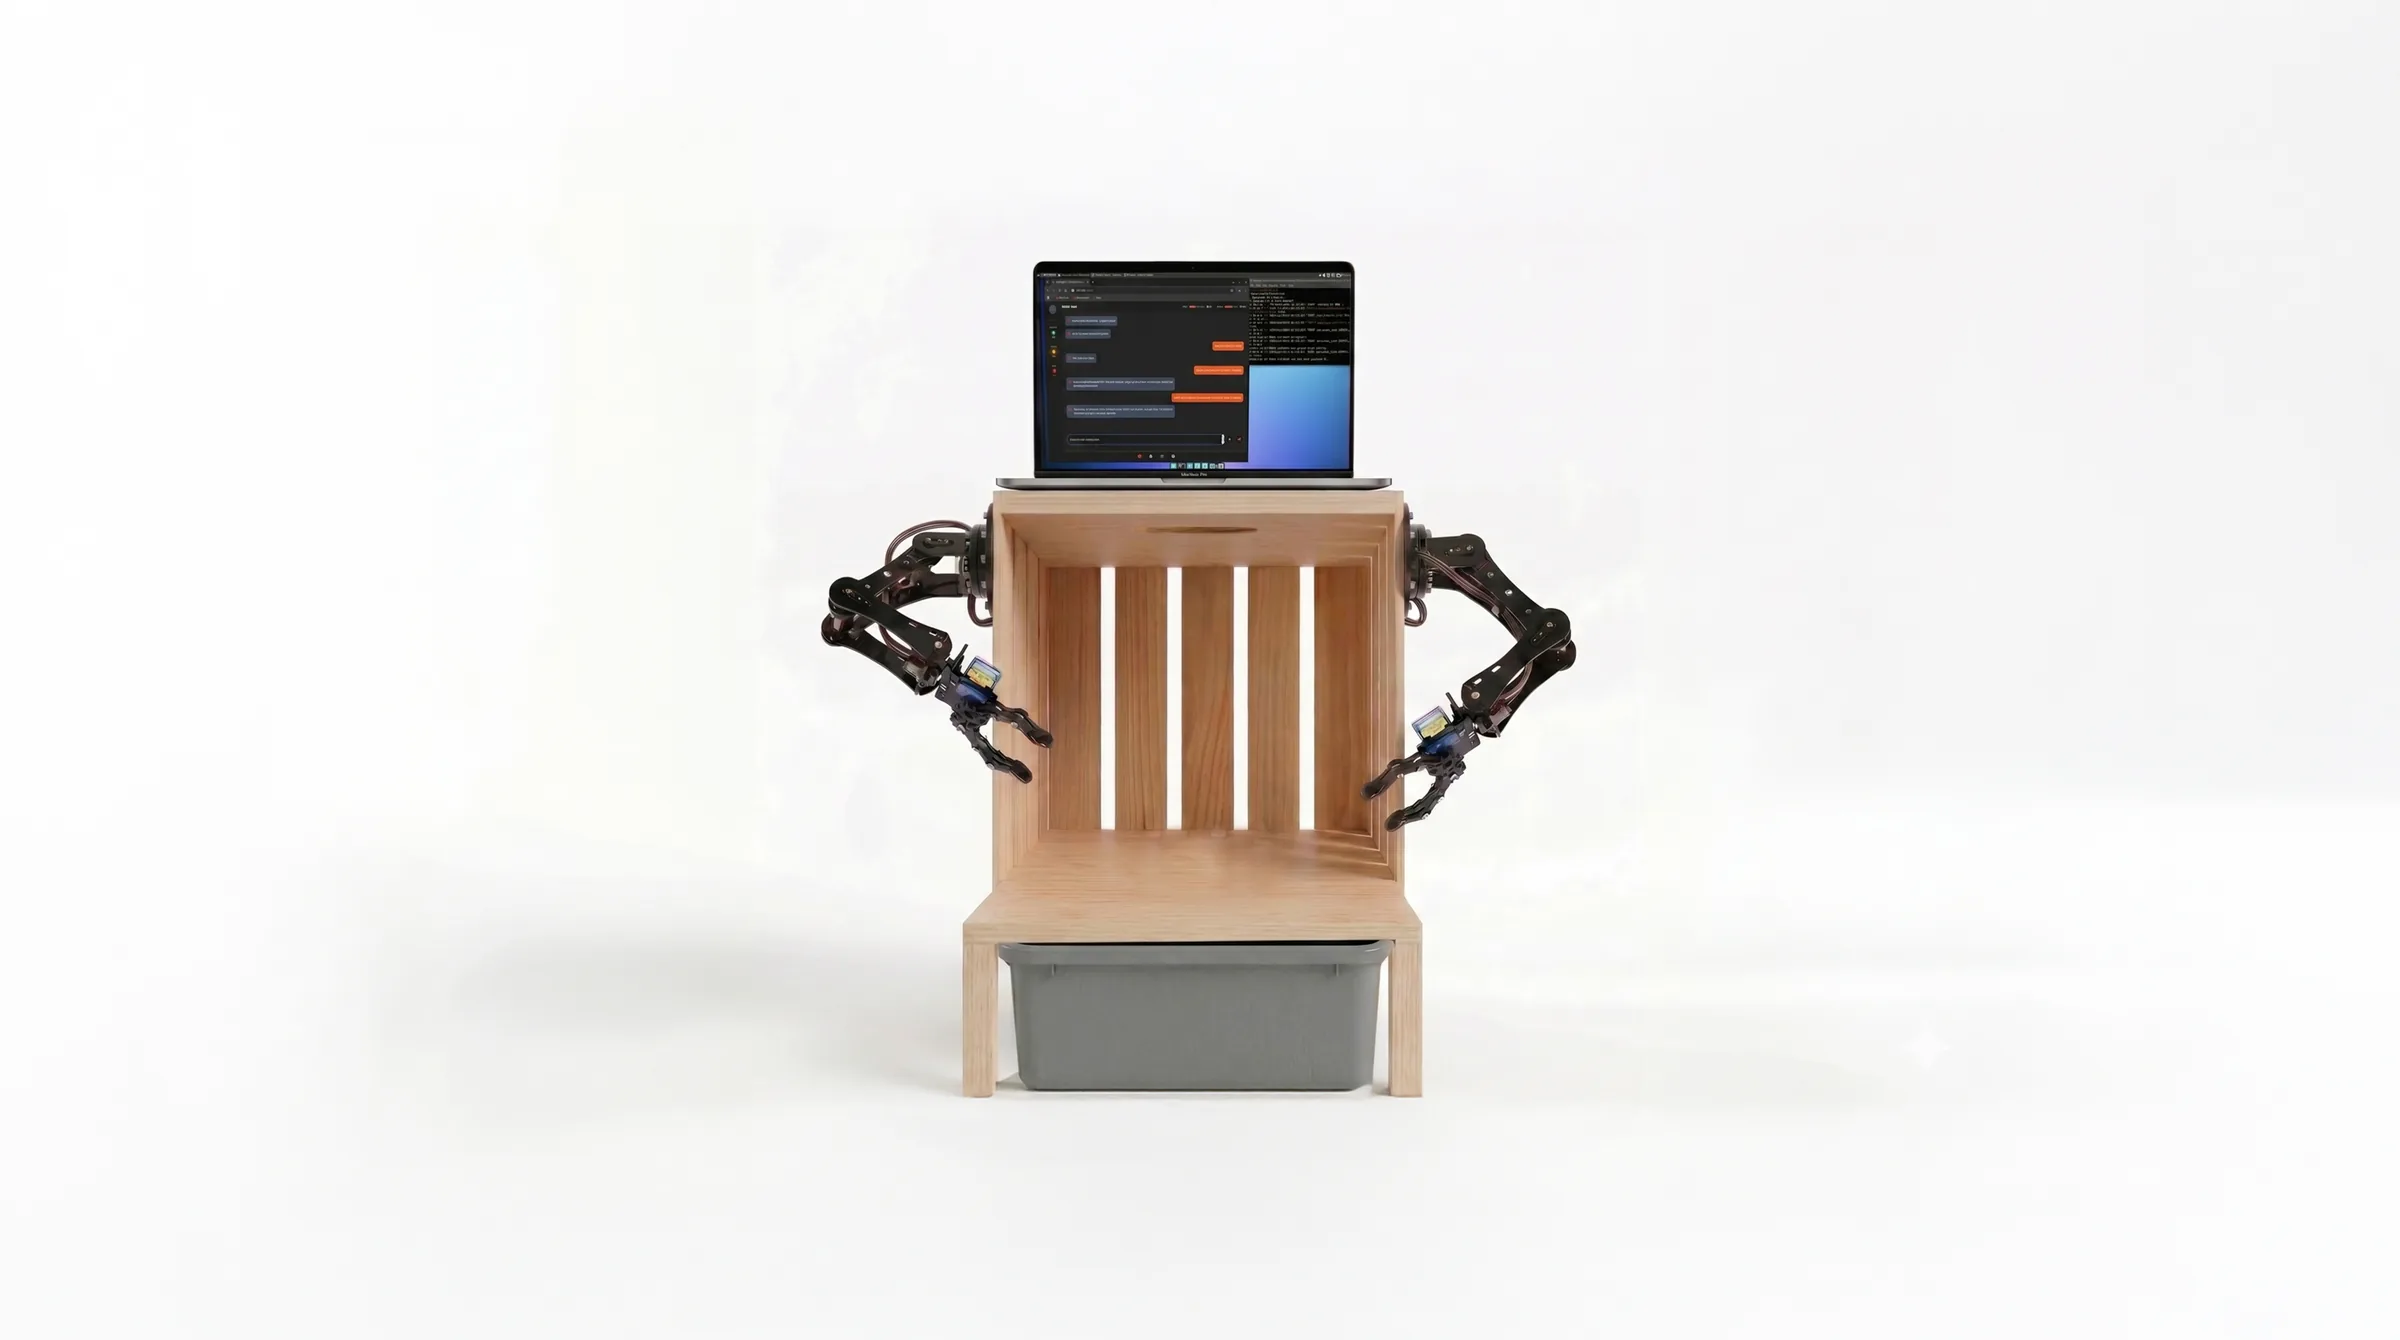
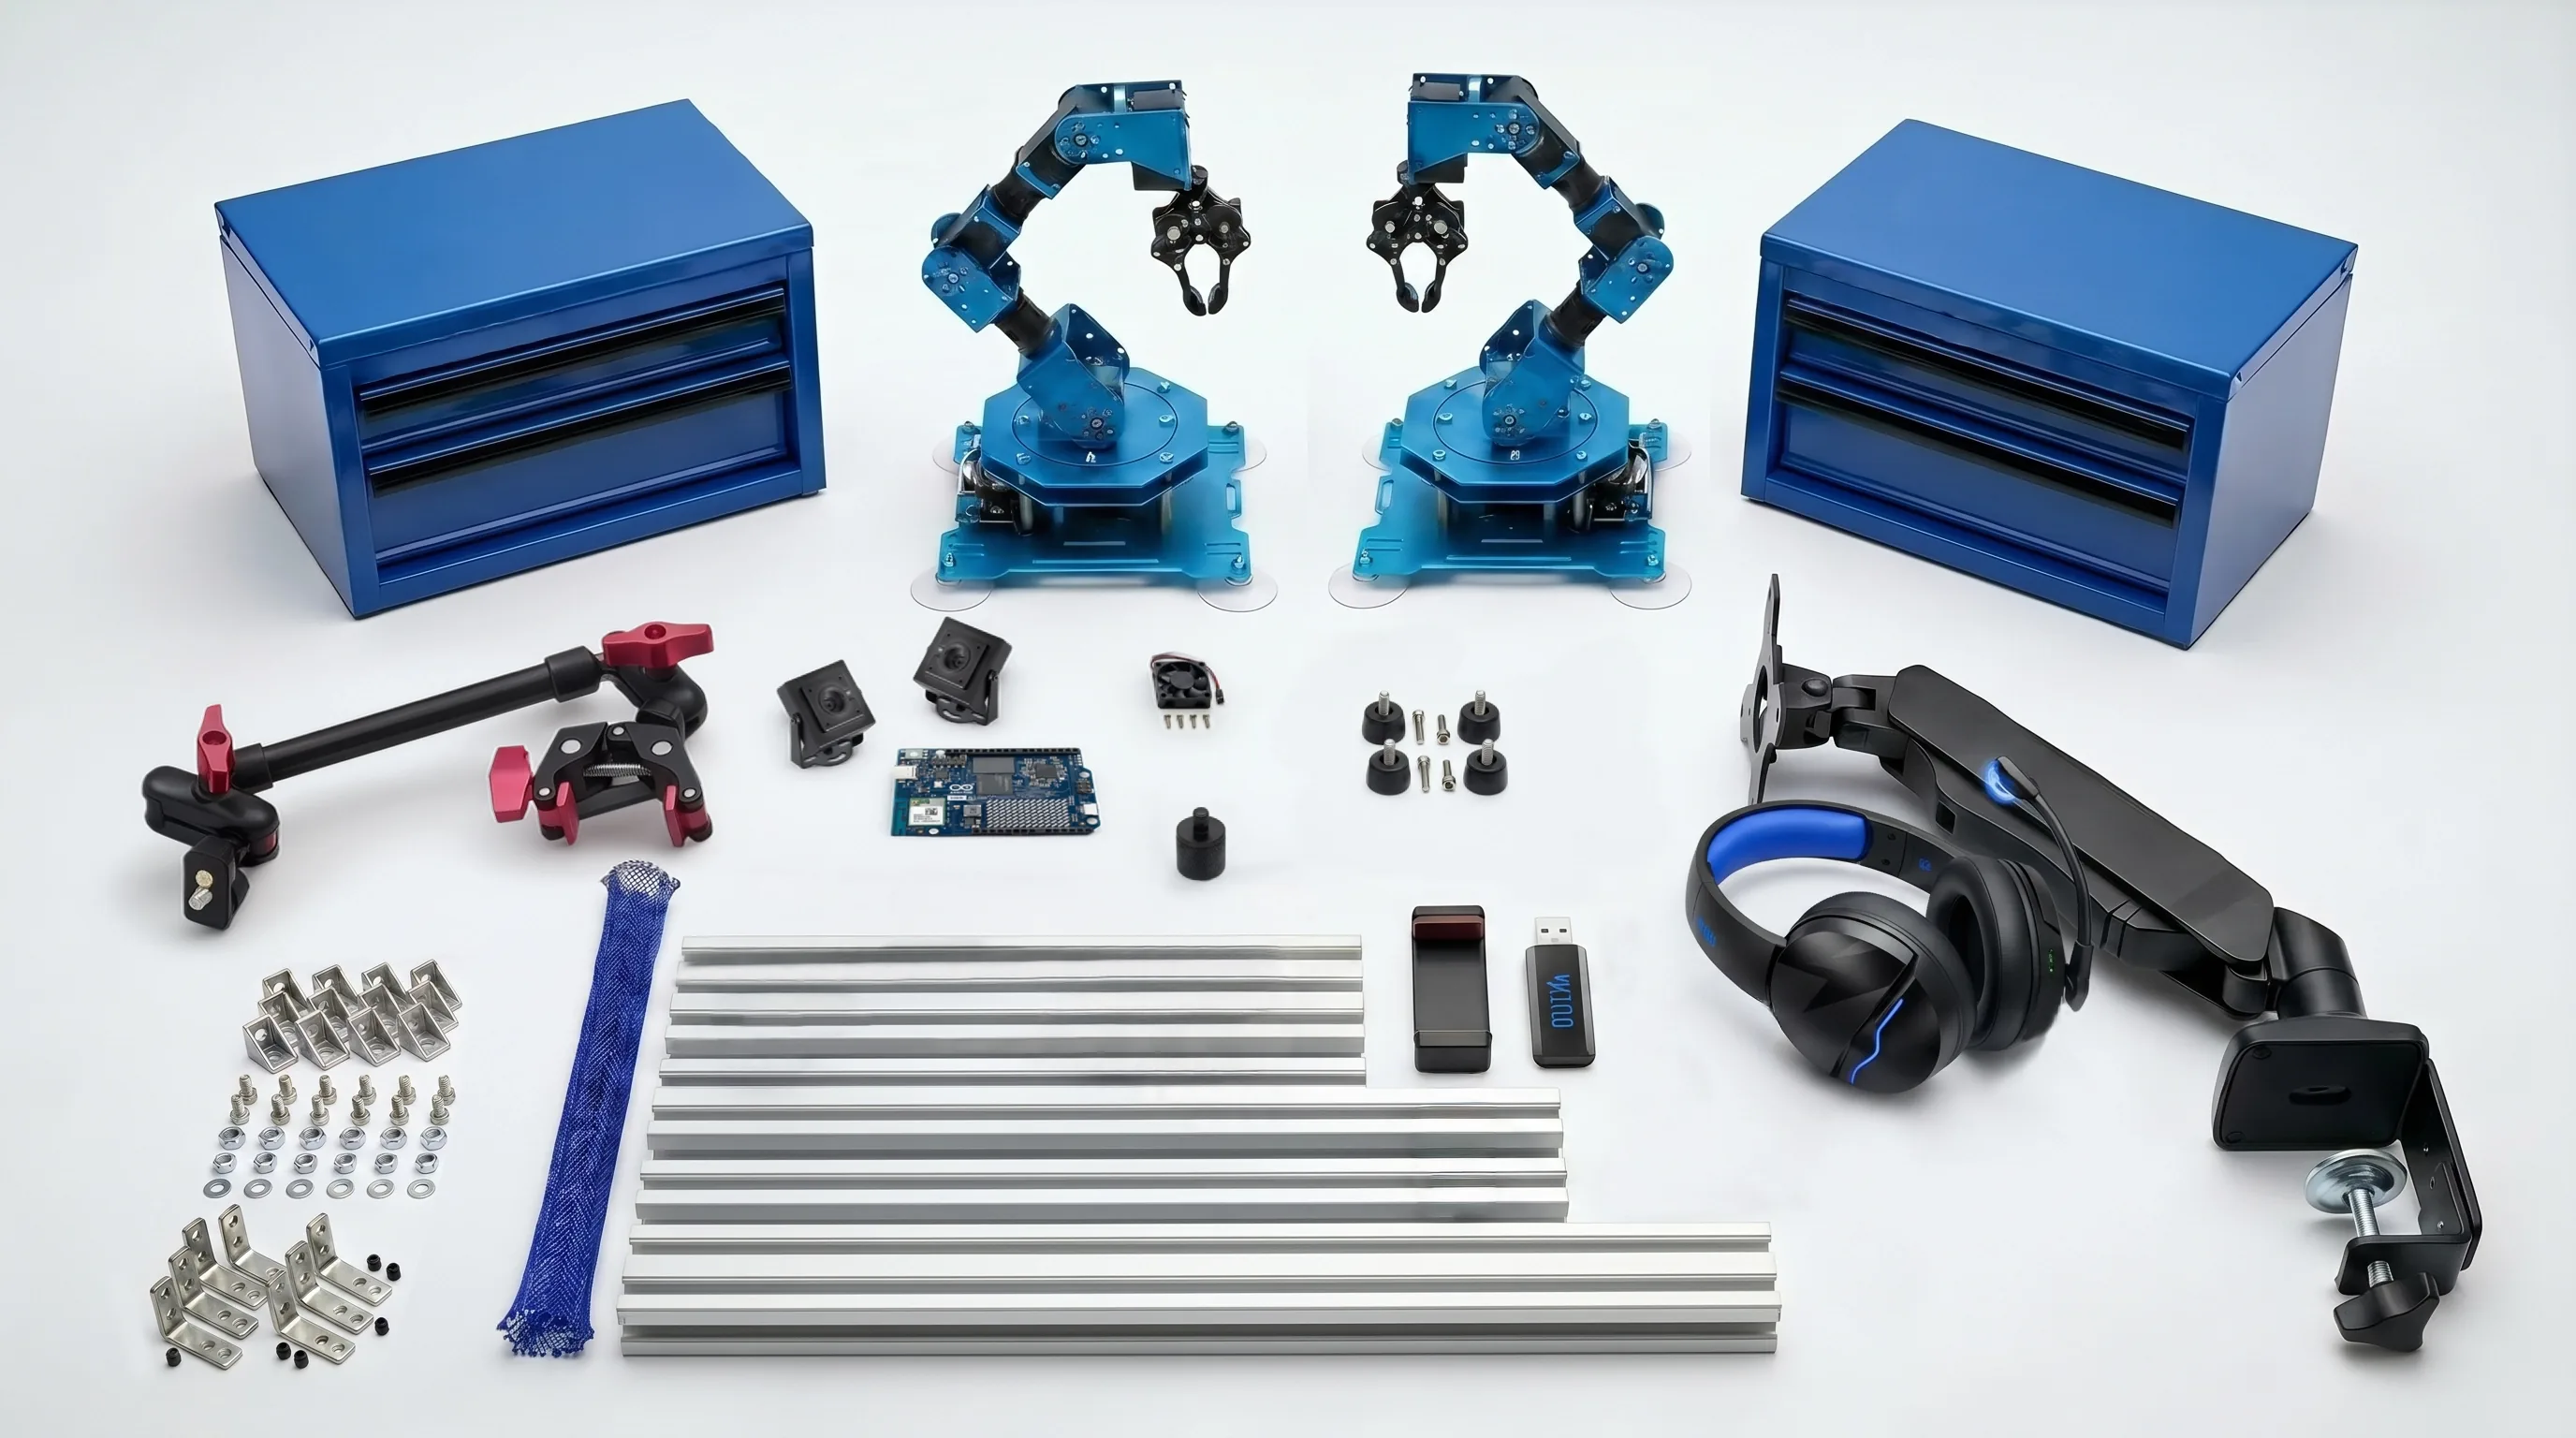
If you choose to build the higher-end reference configuration featuring the dual Hiwonder robotic arms, your physical build will require the following premium setup: Built on a rigid 2020 T-Slot aluminum rail frame (500mm Y-axis, 400mm Z-axis feet, and 300mm X-axis rails), this specific platform variation consists of a 12" x 20" plywood mounting deck, an ELEGOO silicone work mat, dual 6-DoF robotic arms, a gas spring monitor arm, a 13" magic arm holding a 4K USB camera, a standard solderless breadboard, power rails, a microcontroller chip, and integrated mini toolboxes for board and component storage. You are encouraged to modify the dimensions, swap out modules, tear down the rails, or fork the framework entirely as your own project constraints require.

Chapter 5 — VTM Studio Software Modes & Tools
Your studio software configuration consists of separate prototyping modes and functional tools. The purpose of each mode is explained below to help you understand how it functions within the interface and how it processes data during your workstation projects. As you progress through the manual, you will learn how these software nodes interact directly with your physical builds.
Section 5:1 — Main AI (ARC: AI Reasoning Core) & Universal Chat Interface
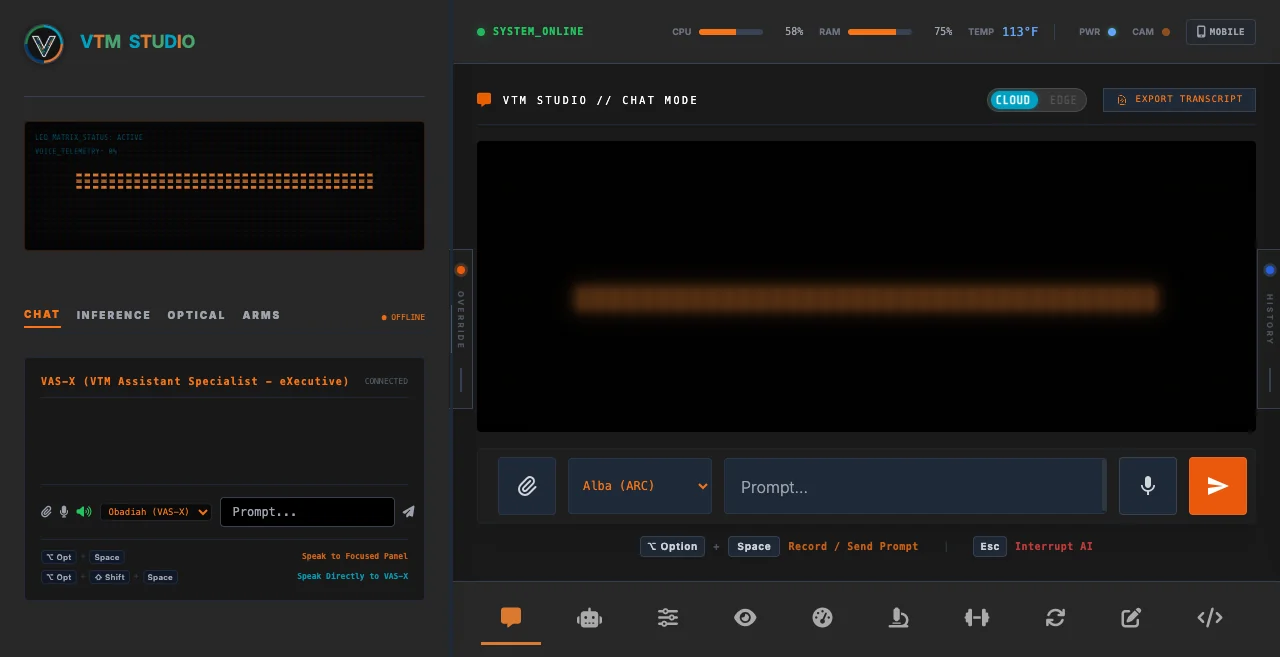
This primary workspace connects to cloud AI providers or your local on-device model, bringing engineering reasoning and code synthesis directly into VTM Studio. ARC (AI Reasoning Core) is your main chat assistant for asking hardware and electronics questions, generating C/C++ and Python code sketches (ready to verify and flash in Code Mode), calculating circuit values, and analyzing uploaded technical documents and logs.
You use this interface as your primary engineering assistant. It gives you a direct chat window where you can ask technical questions, generate firmware code, and analyze engineering files.
- Use the Cloud/Edge Switch in the top header (unlocked in Maker Pro / Physical AI Pro) to toggle between Cloud inference and local offline Edge mode.
- Press Option + Space (or click the microphone button) to start/stop recording a voice query, or to send a typed prompt.
- Press Escape or click the flashing stop button to immediately interrupt incoming text and audio.
- Open the INSTRUCTIONS tab inside the left-side X-Panel drawer to configure custom behavioral rules.
- Click Export to Doc beneath an individual answer to save a Word file, or click Export Transcript in the top header to download the full HTML session transcript.
VTM Studio supports Google AI Studio's Free Tier model suite across three selectable cloud tiers: gemini-3.1-flash-lite (default workhorse),
gemini-3.5-flash-lite (high-speed inference), and
gemini-3.8-flash (flagship reasoning). (Note: Free-tier rate limits, token quotas, and model availability are set by Google and are subject to change at any time.)
- Requests Per Minute (RPM): ~15 RPM
- Tokens Per Minute (TPM): ~250,000 TPM
- Requests Per Day (RPD): ~500 RPD (Flash Lite) / ~20 RPD (Flash)
- Note: Extra keys under the same project share project-level quotas.
- Input Token Window: Up to 1,048,576 tokens
- Output Token Limit: Up to 65,536 tokens
- Supported Chat Uploads:
.pdf,.docx,.txt,.md - Supported Code & Logs:
.ino,.cpp,.py,.json,.csv,.log
GroqCloud Engine Quotas & Token Limits (Physical AI Pro)
In the Physical AI Pro Pack, VTM Studio also unlocks GroqCloud LPU (Language Processing Unit) endpoints and automatic Gemini-to-Groq failover for open-weights models. Below are the reference free-tier parameters for the supported Groq models (subject to GroqCloud provider policy updates):
| Model & Model ID | Speed | Reference Rate Limits | Context Window / Max Completion | Daily Quota |
|---|---|---|---|---|
| OpenAI GPT-OSS 120B openai/gpt-oss-120b |
500 T/s | 8,000 TPM / 30 RPM | 131,072 / 16,384 tokens | 1,000 RPD |
| Alibaba Cloud Qwen 3.8 27B qwen/qwen3.8-27b |
450 T/s | 8,000 TPM / 30 RPM | 131,072 / 16,384 tokens | 1,000 RPD |
| OpenAI GPT-OSS 20B openai/gpt-oss-20b |
750 T/s | 8,000 TPM / 30 RPM | 131,072 / 16,384 tokens | 1,000 RPD |
⌥ Option + Space: Record / Send PromptEsc: Interrupt AI Generation

Execution Diagnostics & Metrics
Inside this primary chat workspace, the interface monitors execution performance in real time. Every text response displays a live diagnostic readout directly beneath the message block:
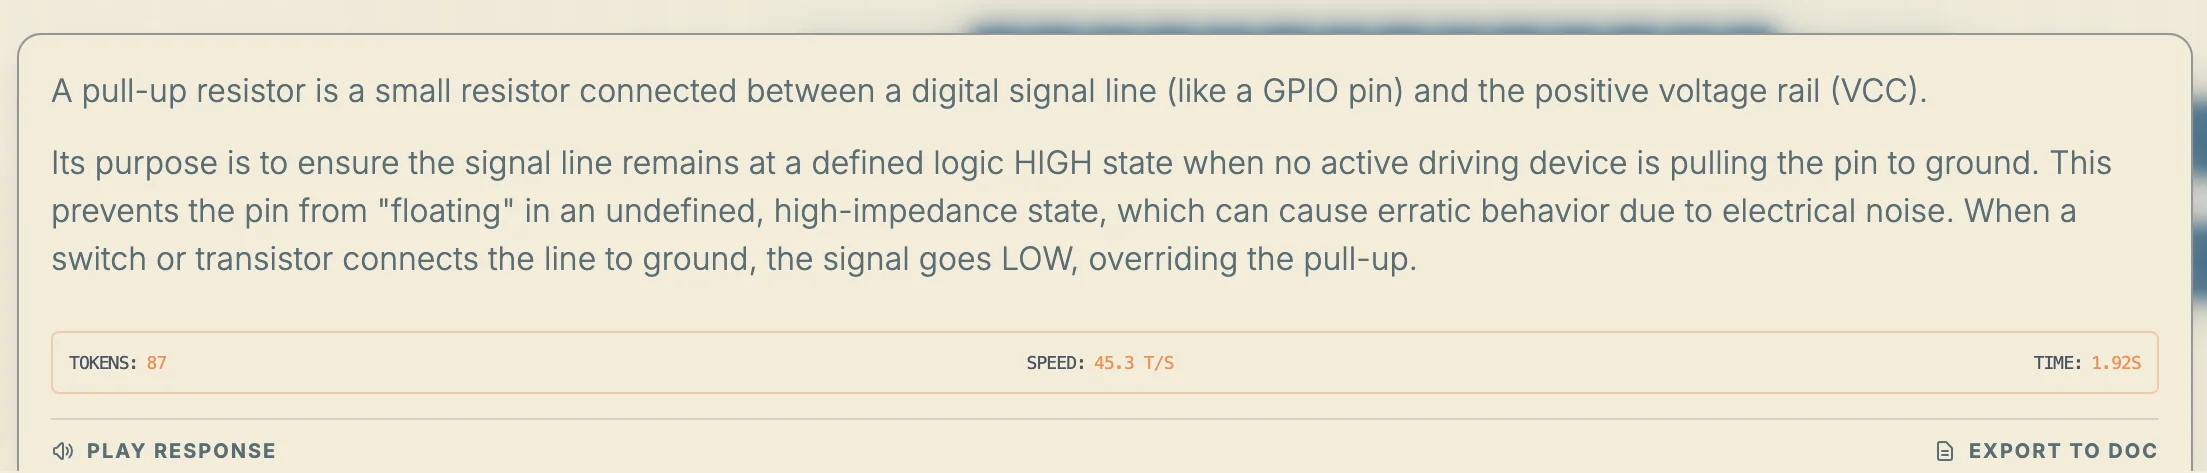
- TOKENS: Displays the exact count of generated text tokens for the active response.
- SPEED: Tracks output velocity measured in tokens per second (T/S).
- TIME: Logs the processing duration in seconds from initial submission to final execution.
Response Actions and Data Export
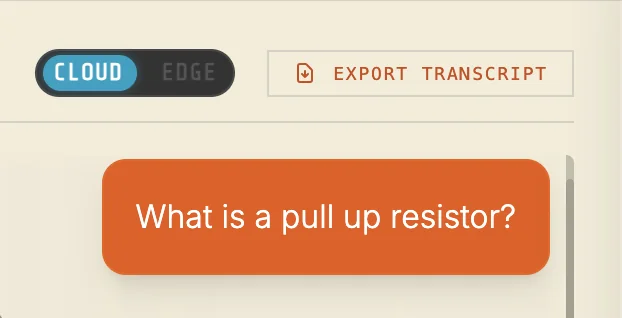
- Play Response: Routes the text response into the audio layer for vocal playback using your selected voice.
- Export to Doc: Extracts that individual message text block to save it as a separate document file.
- Export Transcript: Compiles the entire active chat archive from your session into a single file download, preserving long multi-turn brainstorming and layout notes.
Section 5:2 — VAS-X (VTM Assistant Specialist - eXecutive)
VAS-X (VTM Assistant Specialist - eXecutive) is your dedicated sidebar assistant (unlocked in the Physical AI Pro Pack). While ARC (AI Reasoning Core) serves as your main chat and code generation AI, VAS-X operates as a content-aware workstation navigator and diagnostic assistant with awareness of your active mode, sensor telemetry, camera feeds, and hardware controls.
Inside the VAS-X sidebar panel, you have quick-action CLEAR and EXPORT TRANSCRIPT controls in the header, a dedicated prompt input ("Prompt...only works with Gemini models"), document attachment (.txt, .pdf, .docx, .md), microphone voice input, voice output toggle, voice profile and STT precision selectors (STT: BASE / STT: SMALL), and direct keyboard shortcuts (⌥ Opt + Space to speak to the focused panel, or ⌥ Opt + ⇧ Shift + Space to speak directly to VAS-X).
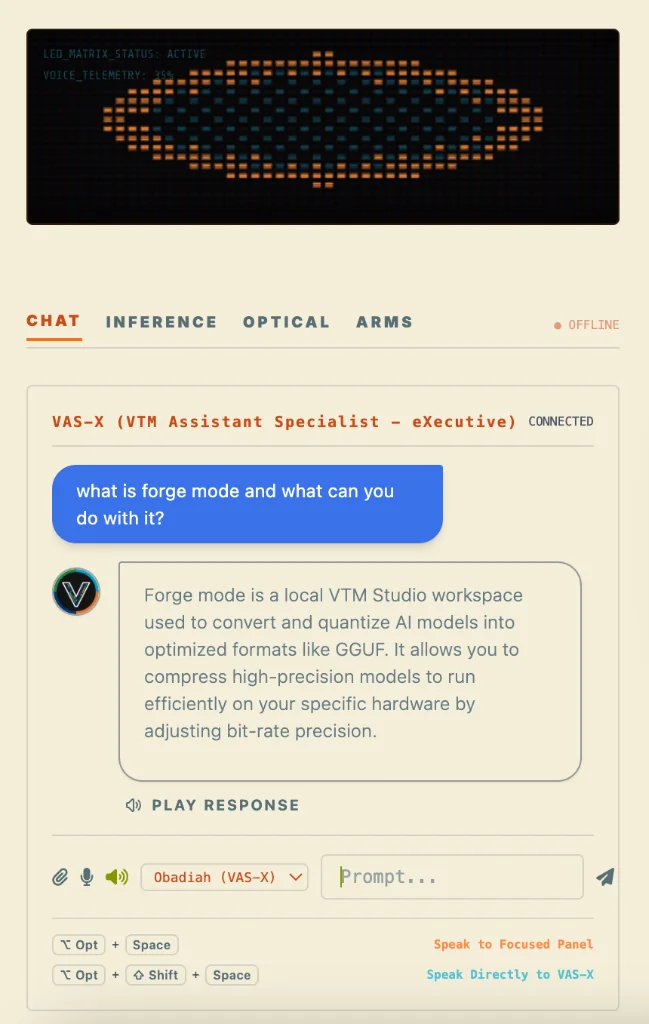
What VAS-X Can Do (Interactive Workbench Commands)
VAS-X executes real UI commands, hardware controls, and workbench actions in response to your spoken or typed requests:
- Switch detectors: VTM Vision, HSV Lock, Cloud Vision.
- Lock target colors: Yellow, Blue, Red, Green, Orange, Purple, Auto.
- Target detection: "Find the green LED" runs a Cloud Vision scan.
- Toggle optical webcam feed & switch
CAM:sources (USB / Android / built-in). - Open reference drawers: Spec Mode VOCAB command glossary and mode guides.
- Spawn layout parts: Drops Arduino Uno, ESP32, or parts onto canvas.
- Magazine page turns: "Turn to page 18" flips Mag Mode.
- Maker Log management: Spawns new project folders and doc tabs.
- X-Panel Arms Tab: Two-way 0–180° MG90S sync & mouse-wheel slider scrubbing.
- Workbench navigation: Instantly switches between all software modes.
You are wiring a circuit in Layout Mode or monitoring live sensor graphs in Science Mode and want a second set of eyes on your setup. Instead of typing out a long description of what is on your screen, you click the VAS Vision camera button in the top-left header bar. VTM Studio captures a snapshot of your active workspace and stages it directly inside VAS-X (Vas-Vision Staged) so you can ask VAS-X to inspect your layout, check your pin connections, or explain the active readout.
- Ensure a Google Gemini model is selected in the Chat Mode model dropdown, then click the X-Panel tab on the left edge of the window to open the VAS-X sidebar.
- Navigate to any active workstation mode (such as Layout Mode, Science Mode, Vision Mode, or Arm Control Mode).
- Click the VAS Vision camera icon in the top-left header bar to capture a snapshot of your active workspace; it will appear as
Vas-Vision Stagedabove the VAS-X prompt input. - Type your question into the VAS-X input (or press
⌥ Opt + ⇧ Shift + Spaceto speak directly to VAS-X) and submit. - Review VAS-X's response in the sidebar chat (or listen to the spoken reply) and apply the recommended adjustments or let VAS-X execute the UI command for you.
Section 5:3 — Dual-Pipeline System Switch (Cloud / Edge Toggle)
The transition between cloud-powered AI reasoning and private, 100% offline on-device inference is controlled directly by the CLOUD / EDGE toggle switch in the top header of Chat Mode (unlocked in the Maker Pro and Physical AI Pro packs).
Flipping this switch changes where ARC (Main Chat) processes your prompts and documents:
- Cloud Mode (
CLOUD): Connects ARC to your selected cloud provider (Google Gemini or GroqCloud) for high-speed frontier reasoning and large context windows, and enables VAS-X (when a Google Gemini model is selected) for content-aware sidebar diagnostics and hands-free workspace navigation. - Edge Mode (
EDGE): Disconnects external cloud API calls and routes ARC to run completely offline on your computer's own CPU and RAM using any local.gguflanguage model in yourlocal_models/folder or imported via Model Forge. Zero internet connection is required, and no prompt or document data leaves your machine.
- Status & Precision Controls: The Chat Mode header switches from the cloud model dropdown to the
EDGE LOCALstatus badge and reveals theQ4 / Q8quantization toggle. - Arcade Warmup Button: The Model Warmup arcade button ("System Cold: Press to Prime Local Model") appears above the chat log. Pressing it loads your active
.ggufmodel into local memory so local chat is ready to respond. - Model-Agnostic
.ggufSupport: You are not locked into a single local model—you can hot-swap any compatible.ggufmodel (such as Qwen, Gemma, Llama, or SmolLM) directly from Model Forge (Tab 3: Run Model).
Section 5:4 — Local Inference (Edge AI)
Local Inference (Edge AI) runs language models completely inside your computer's local RAM and CPU inside Chat Mode (unlocked in the Maker Pro and Physical AI Pro packs). It provides private text generation, code assistance, and document analysis with zero internet connection and zero external API calls.
Hardware & Memory Realities: Because local inference runs entirely on your own hardware, response speed depends directly on your processor and available RAM. On an 8–16 GB desktop or laptop, compact 1B–3B 4-bit (Q4) models stream smoothly; on 2–4 GB single-board computers (such as Raspberry Pi 4B or Arduino UNO Q), lightweight 0.5B–1.5B Q4 models are recommended to preserve system memory.
.gguf Models:
- Adding a Model: Place any compatible
.ggufmodel file (such as Qwen, Gemma, Llama, or SmolLM) into yourlocal_models/folder, or—with Physical AI Pro—open Model Forge to convert Hugging Face.safetensorsweights (1. Convert HF), quantize them (2. Compact GGUF), or clickCLICK TO BROWSE AND ADD .GGUF FILE(3. Run Model) to import and hot-swap models live without restarting the app. - Active Model Awareness: When Edge Mode is engaged and warmed up, ARC automatically detects and reports the exact
.gguffilename it is running on.
Q4 / Q8 Precision Swap
When Edge Mode is active in Chat Mode, the Q4 / Q8 switch in the header lets you swap between 4-bit and 8-bit quantized .gguf models in your local_models/ directory:
Q4(4-Bit Quantization): Loads your 4-bit.ggufmodel for faster token generation and lower RAM usage on standard laptops and SBCs.Q8(8-Bit Quantization): Swaps to your 8-bit.ggufmodel for higher numerical precision when your workstation has the extra CPU headroom and RAM to support it.

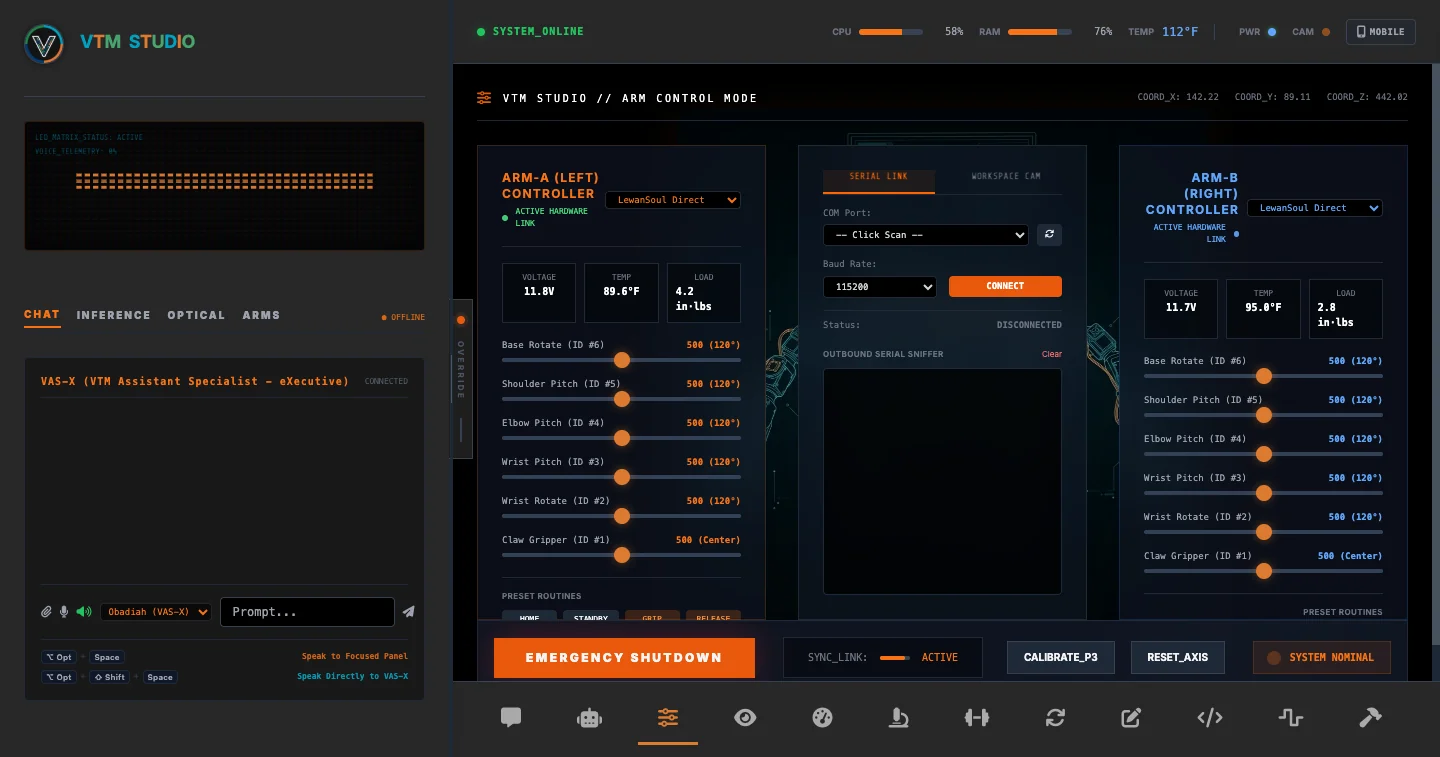
Section 5:5 — Arm Control Mode
Arm Control Mode (unlocked in the Maker Pro and Physical AI Pro packs) is your direct hardware link to physical robotic arms and servo mechanisms. It establishes a live physical bridge over USB serial—sliding a control here commands actual hardware servos to rotate, grip, and position in real time.
- Scan and select the active COM/USB port for the controller board.
- Select your hardware protocol from the top dropdown (
MG90S 5-DoF Arduino PWM, or Beta profiles forESP32 MicroPython,Raspberry Pi Python 3,LewanSoul Direct,Hiwonder LSC, orCustom Protocol BYOH Sandbox). - Baud rate auto-configures (9600 baud for Arduino/LSC, 115200 baud for ESP32/LewanSoul/BYOH).
- Click CONNECT to establish the serial link.
- Drag any joint slider—or click/touch a slider to scrub smoothly with your mouse wheel or two-finger trackpad scroll (Final Cut Pro style, 1° resolution for MG90S, hold
Shiftfor micro-stepping)—or trigger preset routines (HOME,STANDBY,GRIP,RELEASE). All sliders mirror 1:1 in real time with the left X-Panel → ARMS tab. - Click the HARDWARE CONFIGURATOR button at any time to view interactive wiring diagrams, pinouts, and power supply guidelines.
- Use the center column tabs to switch between the Serial Link (resizable Outbound Serial Sniffer & BYOH Sandbox) and Workspace Cam (live optical camera overlay with brightness and focus controls).
Arm Control Mode is built for practical daily hardware tasks at your workstation without writing a new test sketch every time you wire a servo:
- 1. Pre-Assembly Servo Centering (90° Homing): Snap MG90S PWM servos to
90°(or bus servos to500) via theHOMEpreset before bolting on servo horns so mechanical linkages never bind on first power-up. - 2. Safe Mechanical Limit Testing (1° Scroll Scrubbing): Click any joint slider and roll your mouse wheel or trackpad in
1°steps to find exact physical min/max stops without stalling gears against brackets. - 3. Gripper Clasp & Release Calibration: Dial in the exact open and closed angles for Claw Gripper (ID #1) using the
GRIPandRELEASEpresets so jaws hold parts firmly without overheating the servo coil. - 4. Visual Waypoint & Coordinate Capture: Jog each axis into a desired physical pick-and-place posture while watching the Workspace Cam, then record the exact joint angles (
J1–J6) directly into your C++ or Python sketch. - 5. Dual-Arm & Multi-Channel Hardware Testing: Test up to 12 servo channels across
ARM-A (Left)andARM-B (Right)—or adjust joints directly from the left X-Panel → ARMS tab while staying inside Code, Vision, or Science Mode. - 6. Serial & Custom Binary Packet Debugging: Build custom ASCII or hex byte frames in the BYOH Custom Protocol Builder (with presets for
PCA9685,Dynamixel AX-12A, andLynxmotion SSC-32) and inspect every outbound packet in the live Serial Sniffer. - 7. Classroom & Live Hardware Demonstrations: Demonstrate real-time PWM duty cycles, serial baud rates, and multi-axis joint coordination live in STEM labs without compilation delays.
VTM Studio is engineered with an open Bring Your Own Hardware (BYOH) foundation. Makers are not tied to a single proprietary arm kit—you can purchase any 5-DoF or 6-DoF robot arm or buy individual MG90S servos within your budget. VTM Studio includes a production-verified Arduino PCA9685 PWM profile plus 5 additional Beta hardware protocol configurations:
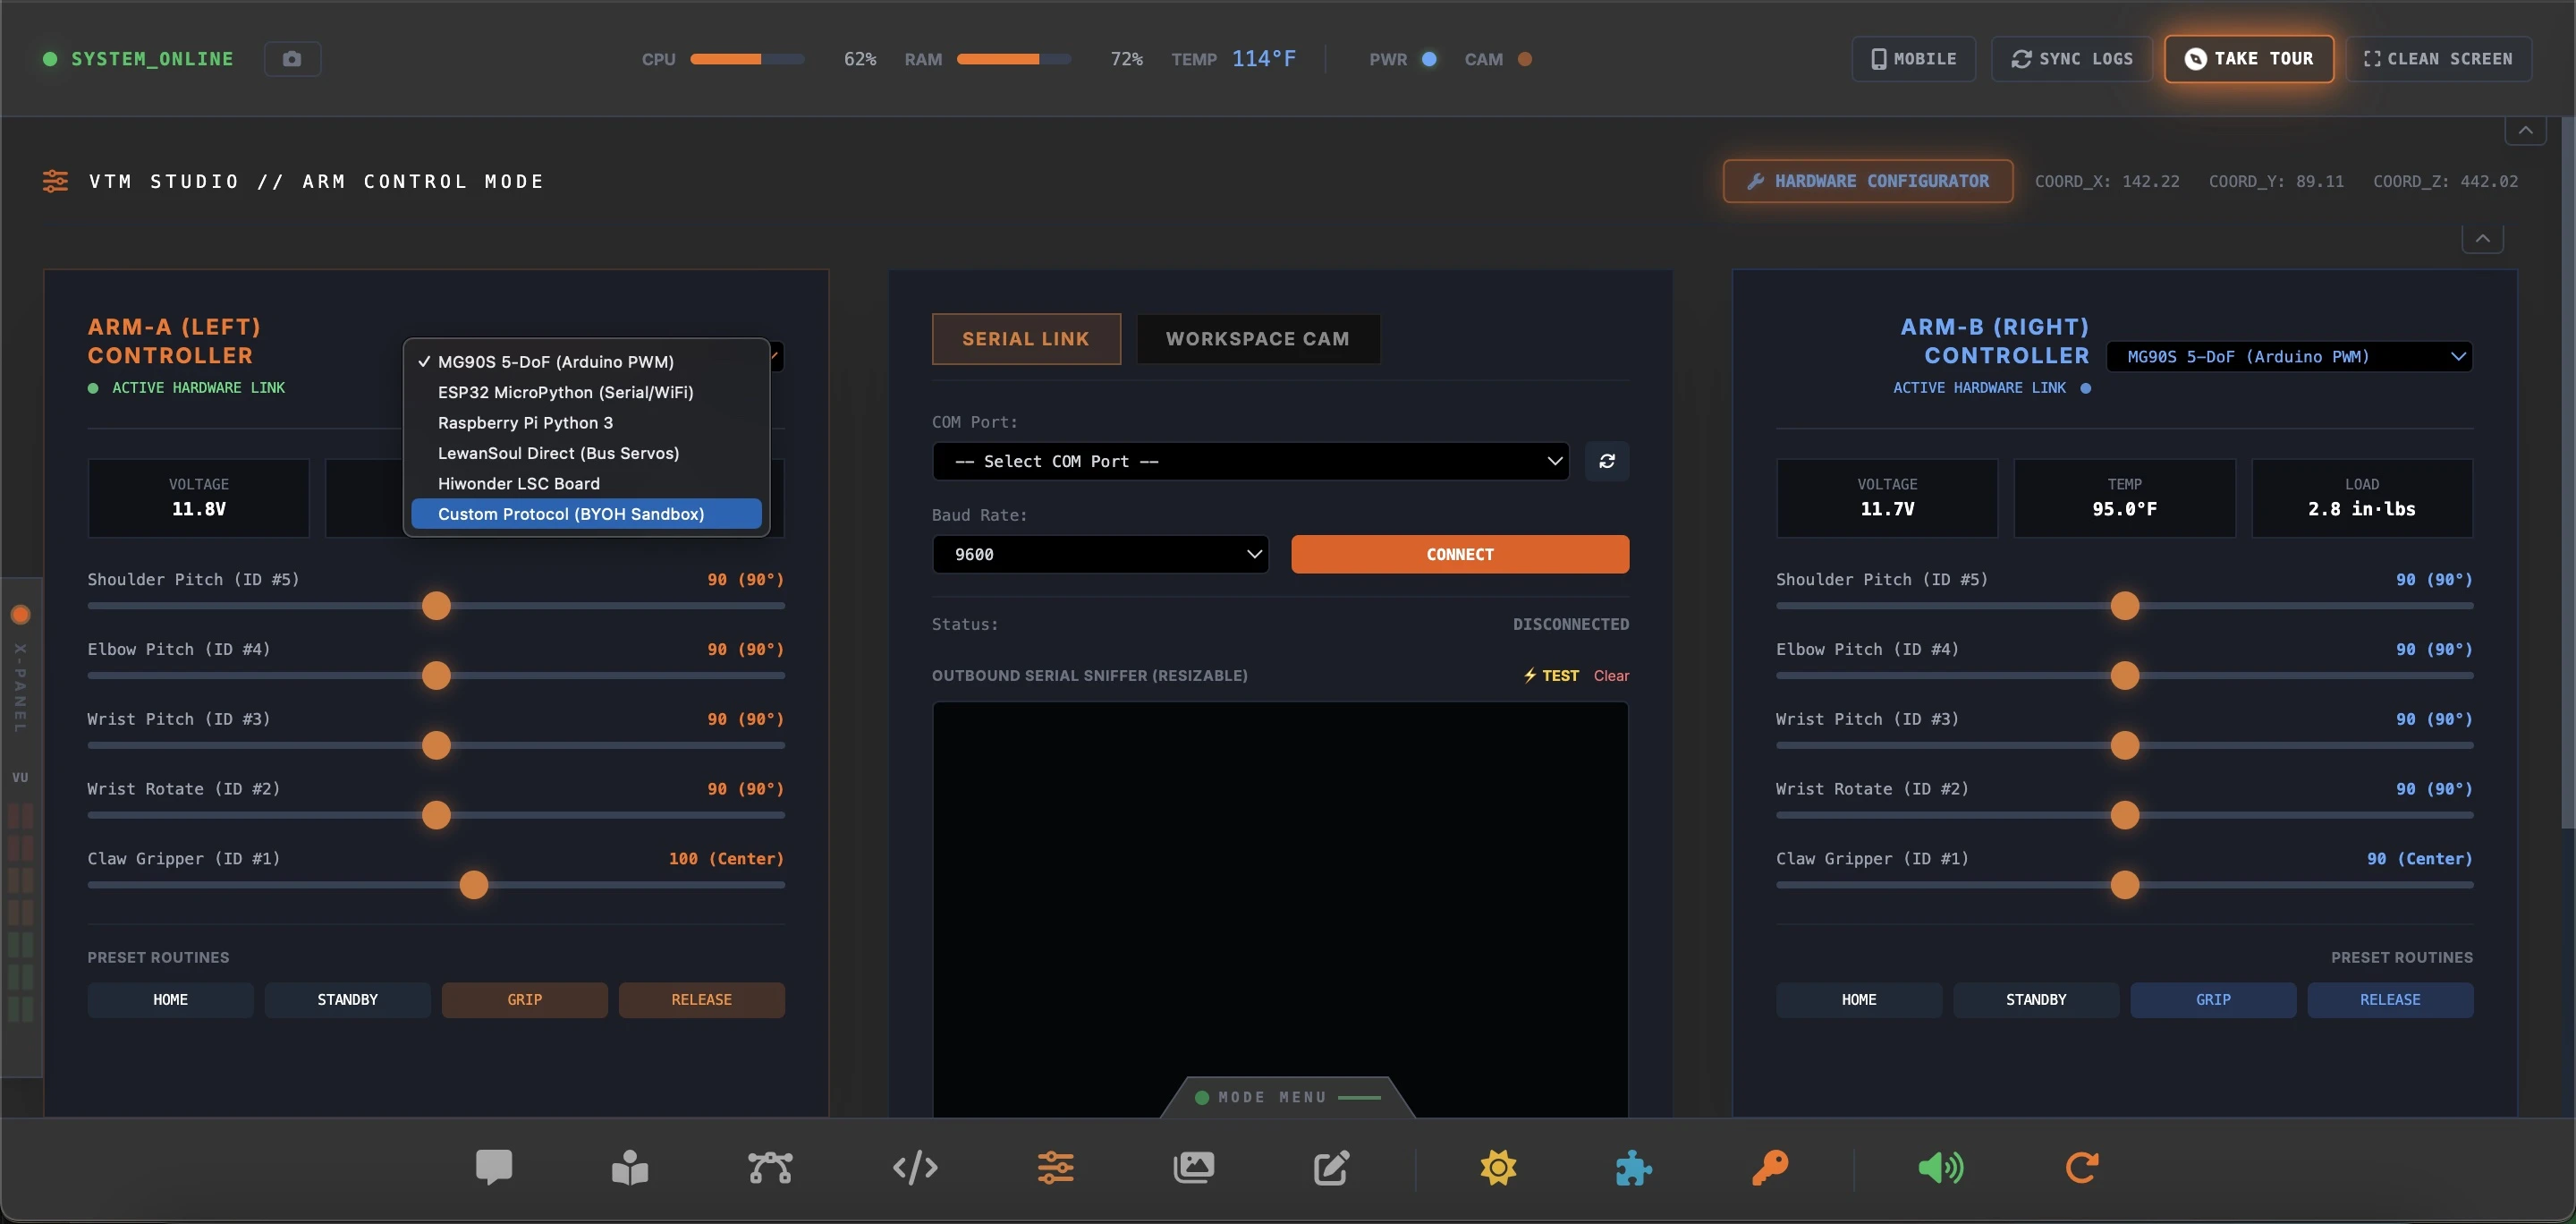
- MG90S 5-DoF (Arduino Nano / Uno + PCA9685 I2C Driver): Primary hardware-verified profile using C++
Wire.h(A4=SDA,A5=SCL) @ 9600 Baud. - ESP32 / ESP32-S3 MicroPython (Beta): Drives PCA9685 via
machine.I2C(GPIO 21=SDA,GPIO 22=SCL) over USB Serial @ 115200 Baud. - Raspberry Pi Python 3 (Beta): Communicates directly via
smbus2over/dev/i2c-1(Pin 3=SDA,Pin 5=SCL). - LewanSoul Direct — LX-16A Bus Servos (Beta): Binary protocol directly over USB Serial @ 115200 Baud.
- Hiwonder LSC Controller Board (Beta): Binary instruction bus protocol @ 9600 Baud.
- BYOH Custom Protocol Builder & Sandbox (Beta): Custom ASCII or Hex binary packet template generator with dynamic placeholders (
{id},{angle},{pos},{pos_lo},{pos_hi},{checksum}), selectable checksum algorithms (Dynamixel NOT-Sum, XOR, Sum, Bitwise NOT), built-in presets (PCA9685,Dynamixel AX-12A,Lynxmotion SSC-32), and a vertically resizable Outbound Serial Sniffer with dry-run simulation mode.
For PCA9685 PWM setups, the included Arduino sketch runs a 200Hz (5ms frame refresh) sub-degree 12-bit PWM motion loop (~0.47° tick resolution) that provides:
- Smooth Velocity Ramping: Caps maximum joint speed to 170°/sec for smooth, controlled motion without sudden mechanical jerks.
- Deadband Settling: Holds position once a joint settles within 0.25° of its target, helping reduce idle servo buzz and hum.
- Clean Serial Handover: Automatically coordinates USB serial access with background telemetry listeners so connecting to an arm does not conflict with other modes.
Accessed via the HARDWARE CONFIGURATOR button in the header, this modal provides an interactive visual setup guide across 4 cards (Arduino, ESP32, Raspberry Pi, and BYOH Custom Builder). Makers can inspect pin assignments, power supply decoupling (5V/3A+ external supply), copy starter scripts, or construct custom packet formats in the BYOH Sandbox and verify output byte streams live in the resizable Outbound Serial Sniffer.
The direct control interface divides your physical workspace into two independent controller columns—ARM-A (Left) and ARM-B (Right)—flanking the central serial and camera console:
- Hardware Link Status Badge: Displays
STANDBY // DRY-RUNwhile testing offline packet generation, and switches toACTIVE HARDWARE LINKonce a serial COM port is connected. - Dynamic 5-DoF & 6-DoF Slider Adaptation: Selecting
MG90S 5-DoF (Arduino PWM)sets sliders to0–180°(90°neutral center) and hides Joint #6; selecting a 6-DoF bus protocol (LewanSoul,Hiwonder LSC, orBYOH Custom) enables all 6 joints across0–1000pulse ticks (0–240°). - Final Cut Pro–Style Wheel & Trackpad Scrubbing: Click or touch any slider in Arm Control Mode or the left X-Panel → ARMS tab to highlight it with an orange focus ring, then roll your mouse wheel or two-finger trackpad scroll for smooth single-degree adjustments (hold
Shiftfor ultra-fine micro-stepping). - 1:1 Two-Way X-Panel Mirroring: Every slider adjustment, protocol change, and connection status update mirrors instantaneously between main Arm Control Mode and the left sidebar X-Panel so you can position joints while working inside Vision, Code, or Science Mode.
- Joint Channel Mapping (IDs #1 – #6):
- Base Rotate (ID #6, 6-DoF Bus Mode): Steers the upper arm rotation platform.
- Shoulder Pitch (ID #5): Primary arm elevation linkage (
90°MG90S /500bus center). - Elbow Pitch (ID #4): Forearm extension linkage (
90°MG90S /500bus center). - Wrist Pitch (ID #3): Secondary positioning joint for gripper angle alignment.
- Wrist Rotate (ID #2): Hand roll orientation.
- Claw Gripper (ID #1): Parallel 2-finger gripper jaws (
Closed / Center / Open).
In 6-DoF bus servo mode (0–1000 ticks), digital slider positions map to physical angles (0°–240°) via:
In Plain English: In 5-DoF MG90S mode, slider values are direct angles from 0° to 180° (with 90° as neutral center). In 6-DoF bus servo mode, pulse commands from 0 to 1000 ticks map across 0° to 240° (with 500 as 120° neutral center).
Positioned between the left and right arm controllers, the center console provides two switchable operational tabs:
[ Serial Link Tab ] ────── [ Workspace Cam Tab ]
[ COM Port Selector ] ──── [ Scan Ports ]
[ Baud: 9600 / 115200 ] ── [ CONNECT ]
- COM Port Scanner & Auto-Baud: Click Scan to enumerate active USB serial ports; Baud Rate automatically selects
9600(MG90S Arduino PWM / Hiwonder LSC) or115200(ESP32 / Raspberry Pi / LewanSoul / BYOH Custom). - Outbound Serial Sniffer (Resizable): Live packet monitor logging every outbound ASCII command (e.g.,
<1:90>) or Hex frame with a 30ms rate-limiter (~33Hz ceiling) to prevent servo buffer flooding, plus [TEST] ping and Clear controls. - Workspace Cam Tab: Built-in WebRTC optical camera viewer with Toggle Feed, slide-out Brightness and Focus adjustment drawers, and a live Detected Targets list.
- Preset Routines (Delta-Timed Multi-Axis Moves): Instant posture buttons at the bottom of each arm card that sequence joints with proportional travel delays:
- HOME: Returns all active joints to their neutral center index (
90°for MG90S /500for bus servos). - STANDBY: Moves the shoulder, elbow, and wrist into a compact resting posture.
- GRIP: Closes Claw Gripper (ID #1) to hold a component or PCB edge.
- RELEASE: Opens Claw Gripper (ID #1) jaws to release the held part.
Always power multi-servo arms from a dedicated external
5V/3A+ power supply (sharing a common GND with your board)
rather than the microcontroller's 5V USB pin. Avoid stalling
MG90S gears against hard mechanical stops under load.
Section 5:6 — Forge Mode
Model Forge (unlocked in the Physical AI Pro Pack) is VTM Studio's local model conversion, quantization, and runtime studio. While frontier cloud models (Google Gemini and Groq) provide high-capacity cloud reasoning, Model Forge lets you convert, quantize, and hot-swap local .gguf models directly on your own computer.
You have downloaded open model weights from Hugging Face onto your computer and want to run them offline in Section 5:4 — Local Inference (Edge AI). You use Model Forge's 3-tab workflow to convert local .safetensors to .gguf, compact weights to 4-bit or 8-bit via the built-in quantization engine, or click to browse and import any .gguf file in Tab 3 to run and hot-swap it live in the local inference runtime.
- Download your preferred model weights from Hugging Face to your local computer first.
- In Tab 1 (1. Convert HF), point to your local Hugging Face folder (containing
.safetensorsandtokenizer.json) to convert it into a local.gguffile. - In Tab 2 (2. Compact GGUF), select a source
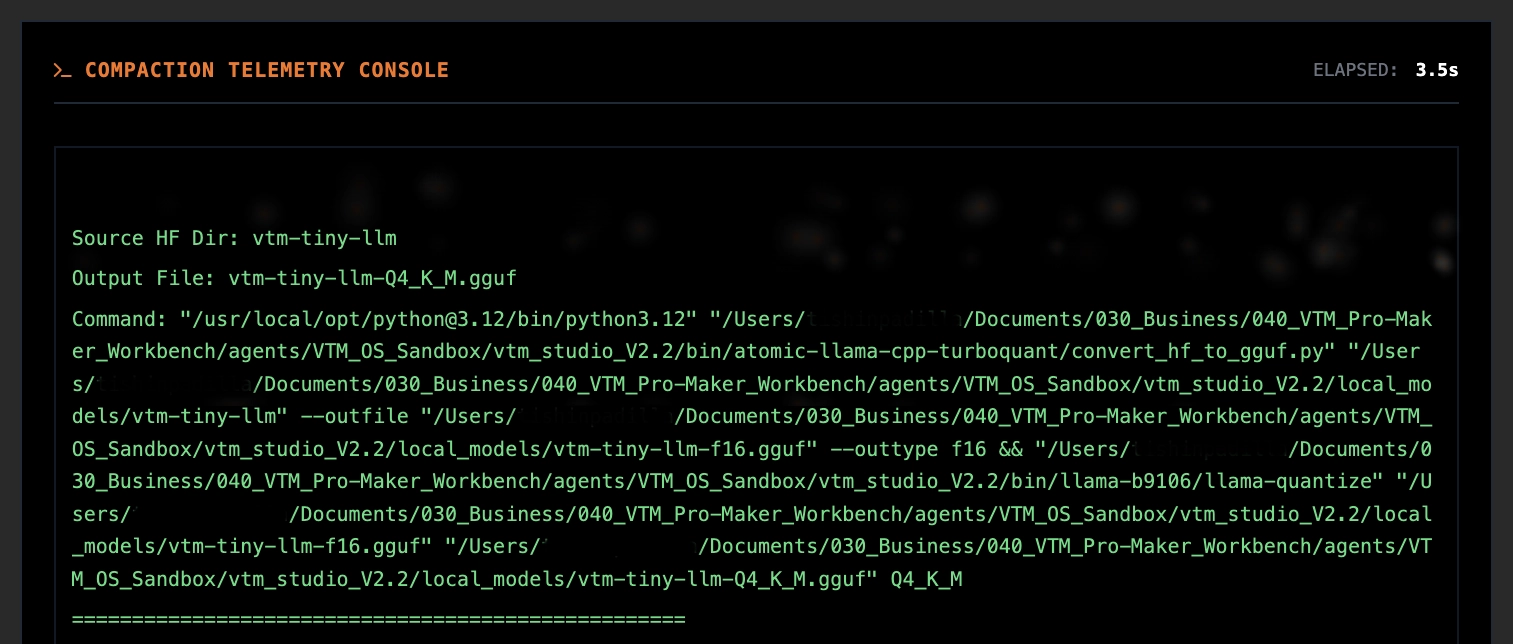
.ggufmodel, choose your target quantization format (Q4_K_Mfor balanced speed orQ8_0for higher precision), set CPU threads, and start the compaction process. - In Tab 3 (3. Run Model), click to browse and import any
.gguffile intolocal_models/, select it from the dropdown, and click ENGAGE LOCAL MODEL (SWAP) to hot-swap it live.
Model Forge puts the conversion, quantization, and local model management pipeline directly on your workstation. It combines your local AI utilities into a clean 3-tab interface so you can convert, compact, and run verified .gguf models locally.
Quantization reduces the numerical precision of model weights—for example, compacting 16-bit floating-point weights down to 4-bit or 8-bit integers. This shrinks file size and lowers RAM usage so models can run on local desktop hardware.
Model Forge organizes local model preparation and execution into a 3-tab workflow:
- 1. Convert HF (Tab 1): Scans a local Hugging Face model folder you downloaded to your machine, verifies the required files (
config.json,tokenizer.json, and.safetensorsweights), and converts them into a standard.ggufmodel file. - 2. Compact GGUF (Tab 2): Compacts an existing local
.ggufmodel file into a lower bit-rate precision layout (such asQ4_K_MorQ8_0) using the built-in local quantization engine. - 3. Run Model (Tab 3): Provides a click-to-browse
.ggufimporter (CLICK TO BROWSE AND ADD .GGUF FILE) that copies or uploads any.ggufmodel intolocal_models/and lets you hot-swap the active model in the local inference runtime without restarting VTM Studio.
When running a manual quantization cycle under Tab 2, the control dashboard provides direct configuration over the output precision and processing load:
- Compaction Target: Determines the compressed bit-rate
depth of your finished local model file:
Q4_K_M: Standard 4-Bit (Balanced processing efficiency and speed).Q8_0: 8-Bit (Near lossless numerical precision, requires more system memory).Q3_K_M: 3-Bit (Lightweight footprint optimized for lower-specification hardware).Q5_K_M: 5-Bit (High quality processing and weight retention).
- Compute Threads: Adjusts your computer's processor thread allocation for the quantization task. This defaults to 8 threads to preserve baseline system responsiveness so your computer remains fully usable while the engine runs.
The integrated lower console displays the live status of the quantization engine thread in real time:
- ENGINE STATE: Monitors the immediate operational condition of the engine thread (e.g., Standby, Ready, or Processing).
- ELAPSED: A live on-screen timer tracking the absolute quantization duration down to tenths of a second.
Section 5:7 — Spec Mode
Spec Mode is VTM Studio's component specification, schematic, and pinout inspection interface. VTM Studio ships with starter sample images as working examples, and leaves the remaining component slots open for you to finish and customize with your own parts: you can upload your own photo/cutout for any component or schematic—or use AI to generate the image yourself and upload it—and every part and image you save in Spec Mode automatically syncs with Layout Mode.
You are wiring a voltage regulator or custom sensor on your breadboard. You say "show voltage regulator" or click it in the glossary to inspect its pinout and datasheet while your hands stay on the hardware. When a component slot shows a placeholder (or when you add a new board you own), you upload your own component image or AI-generated visual into Spec Mode—and it immediately syncs to your Layout Mode library.
- Say "open spec mode" or type the command to enter Spec Mode.
- Say "show uno", "show servo", or any component name to load the schematic, component image, and datasheet panels.
- To add or replace a component's visual, upload your own photo/cutout (created in Image Mode) or an AI-generated image in the Spec Editor and save—your part and image automatically sync to Layout Mode.
- Click the expand button (⤢) on the schematic panel to maximize it to full-screen.
- Say "clear screen" or type "clear" to clear the active component and reset the view.
- Use the scrollable Command Glossary on the right to click-to-copy any voice phrase.
The interface organizes component inspection and customization into dedicated panels:
VTM Studio includes sample component visuals as starter examples so you can see how the mode works right away; unpopulated slots display clean SVG vector placeholders until you add your own images (nothing is missing or broken). Upload your own component photo, a cutout made in Image Mode, or an AI-generated component image into Spec Mode, and it automatically syncs into your Layout Mode component library.
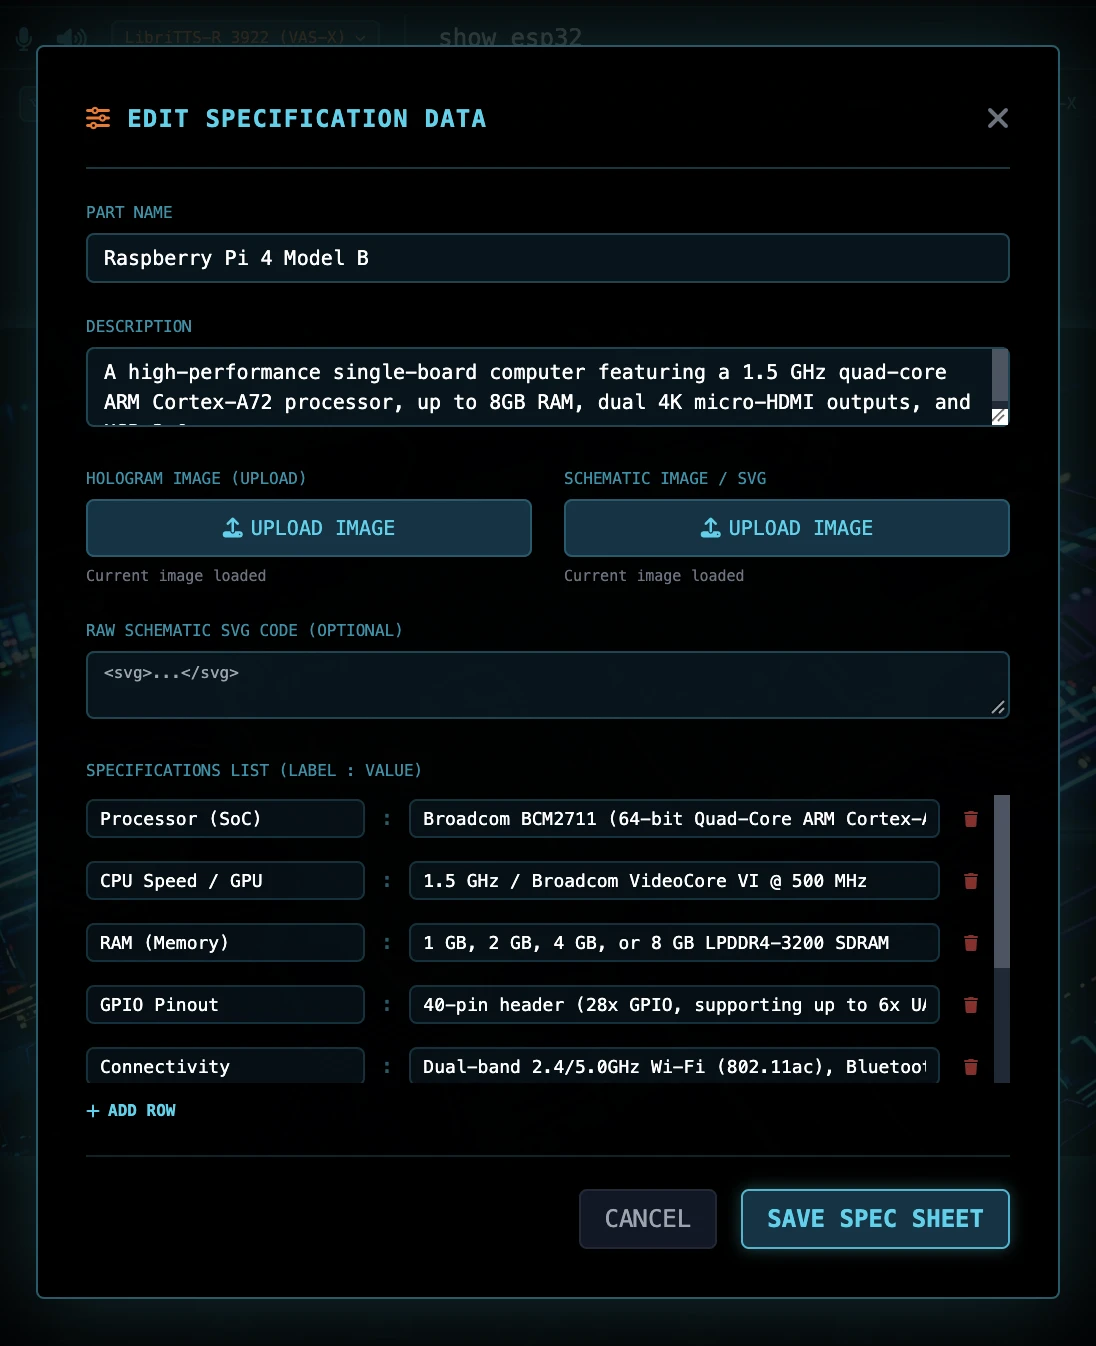
Every component carries a comprehensive specification panel displaying model numbers, operating voltages, current draws (idle/active/stall), pin counts, pinout color codes, memory configurations, processor architectures, gear types, physical dimensions, and package types.
Built-in speech-to-text integration allows hands-free component selection. Say "show servo" or "show raspberry pi 4" and the system loads the corresponding schematic, component visual, and datasheet instantly.

A scrollable command reference drawer listing every supported voice/text command. Each command phrase is individually clickable—clicking copies the command text to the clipboard and auto-pastes it into the command input bar, ready to execute with a single Enter press.
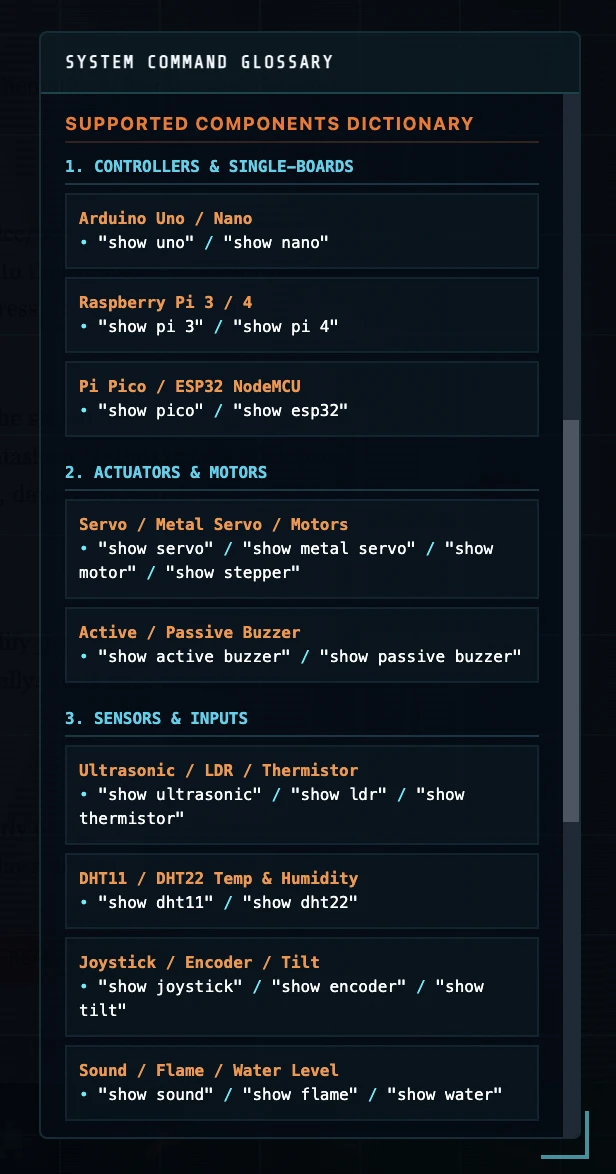
Loading a new component triggers a staged panel reveal: the schematic panel loads first, followed by the component visual, and then the specification datasheet, accompanied by subtle audio confirmation cues.
Features a built-in parameters editor in the active HUD view. Modify pin counts, labels, dimensions, descriptions, operating parameters, custom component/schematic images, and datasheet URLs dynamically. Edits save directly to storage and sync automatically with Layout Mode.
Study microchip block diagrams and pin allocation schematics clearly using the maximize control (⤢ / ⤡), which expands the schematics view to full-screen above all overlay sidebars.
When saving custom parts in Spec Mode, saving a component with a matching name but different physical dimensions automatically creates a distinct variant entry so your existing component specifications are never overwritten.
Section 5:8 — Layout Mode
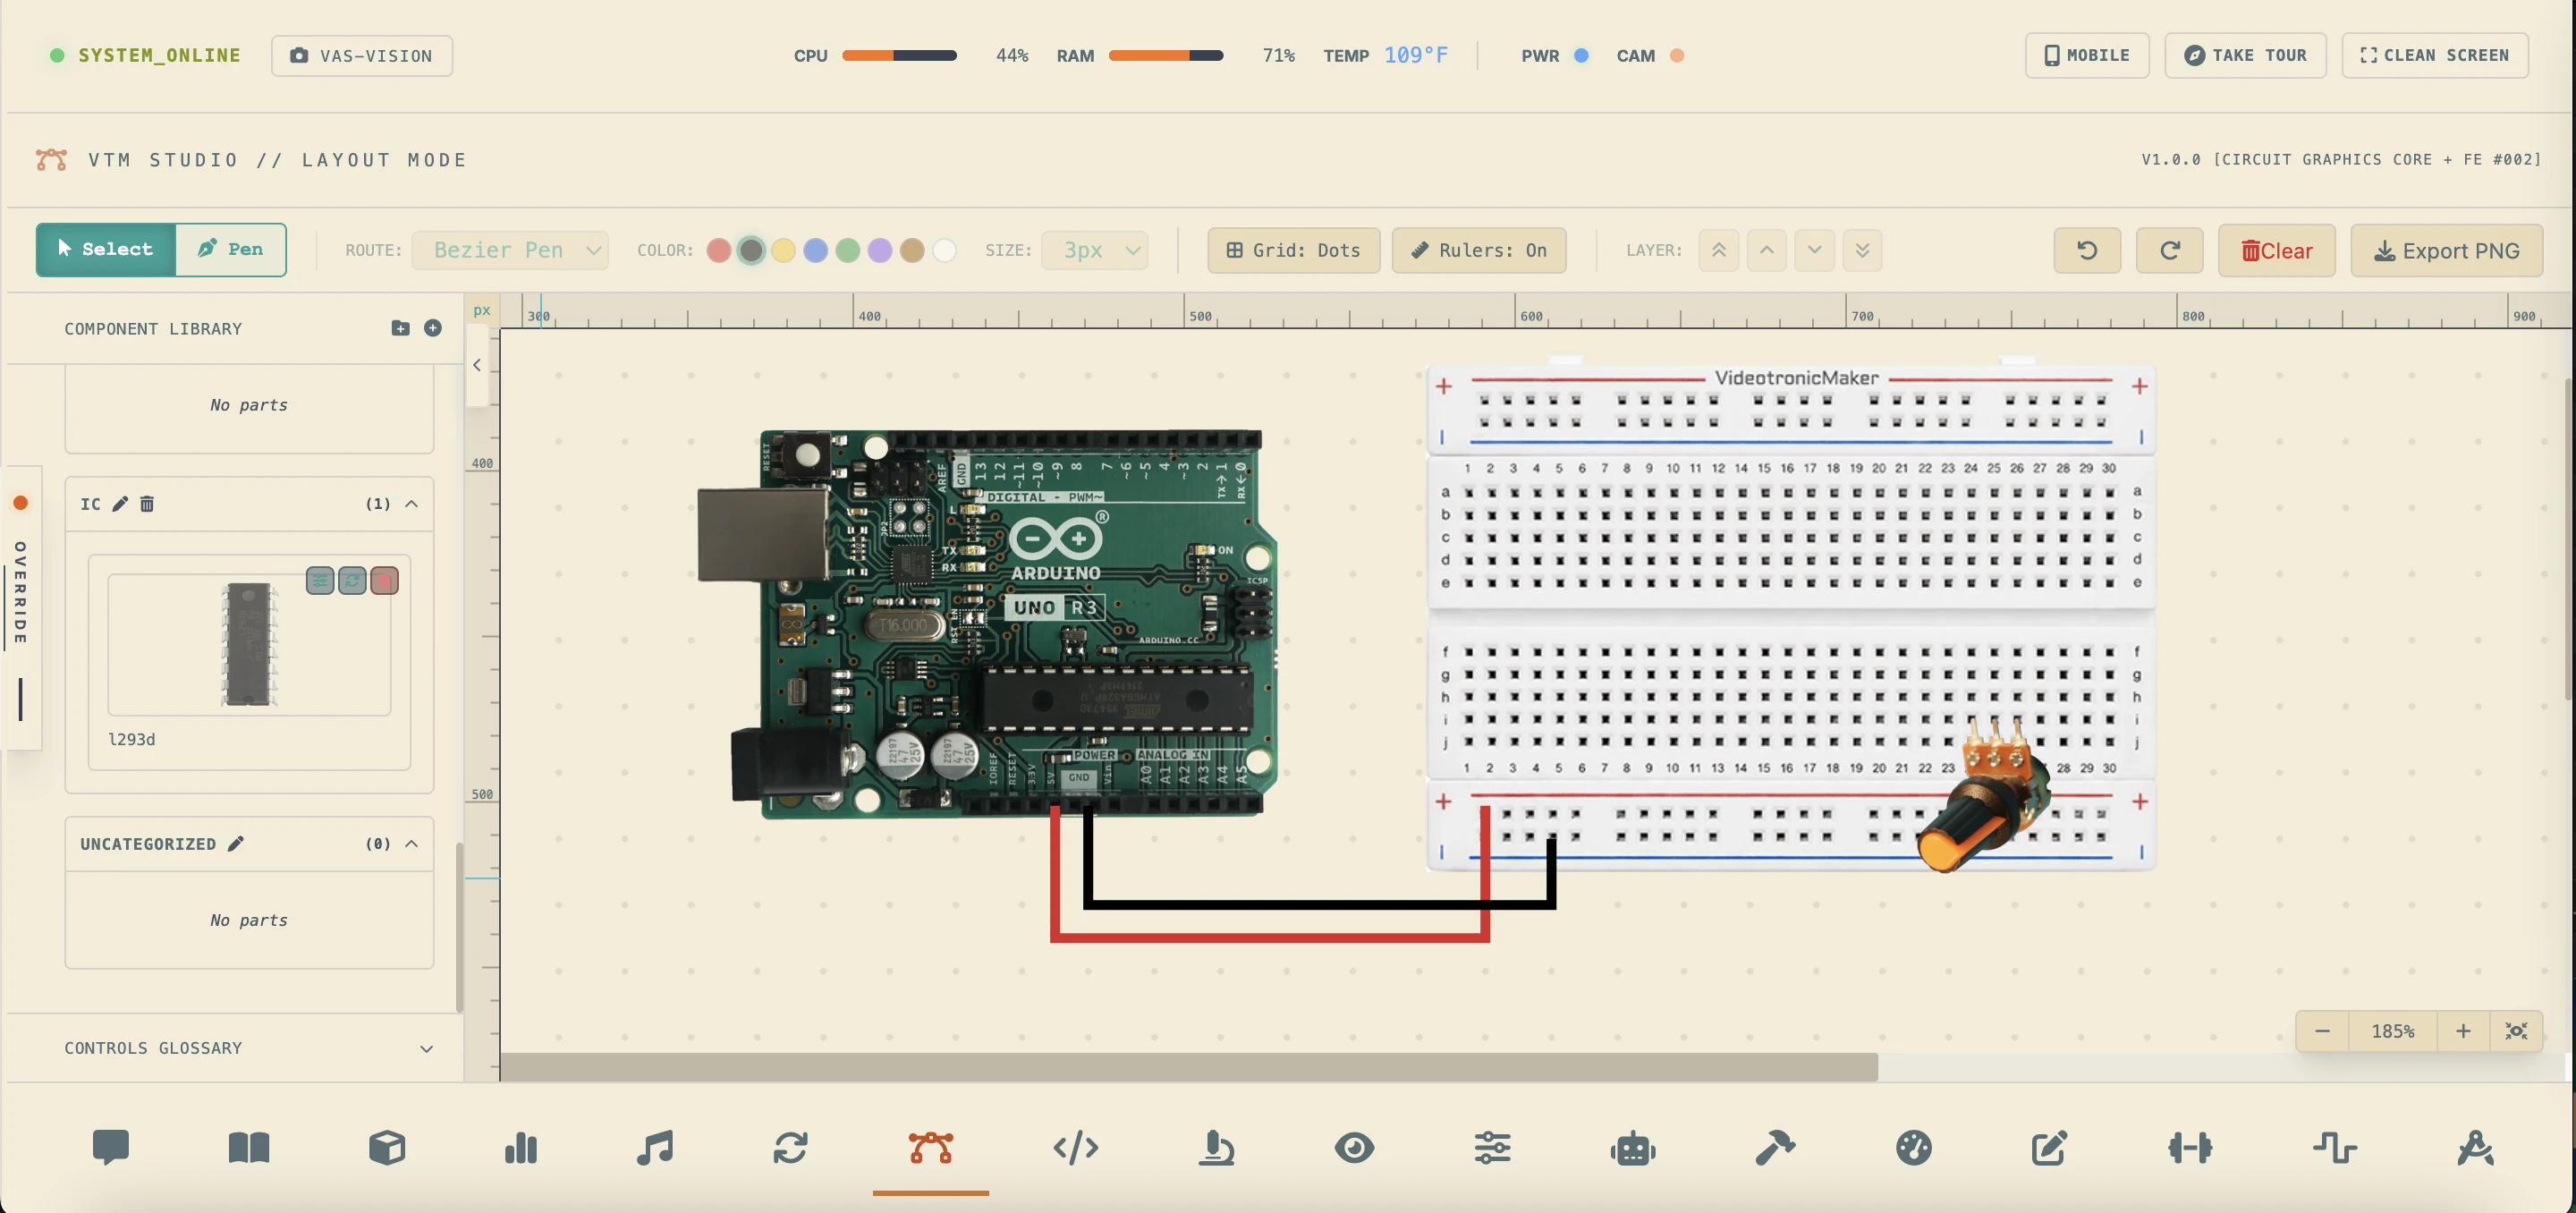
Layout Mode is VTM Studio's 2D circuit wiring and breadboard layout canvas
designed to let you plan layouts directly alongside your code and
telemetry. VTM Studio includes starter sample cutouts (such as an Arduino Uno and breadboard) as working examples, and you build out the rest of your component library yourself: upload your own part photo into Image Mode (Section 5:9), cut it out, and save it to a category—or upload/AI-generate a component image in Spec Mode (Section 5:7)—and it immediately appears inside Layout Mode ready to drag onto the canvas, route vector jumper wires, save .vtml project files, and export .psd, .svg, and .png wiring diagrams.
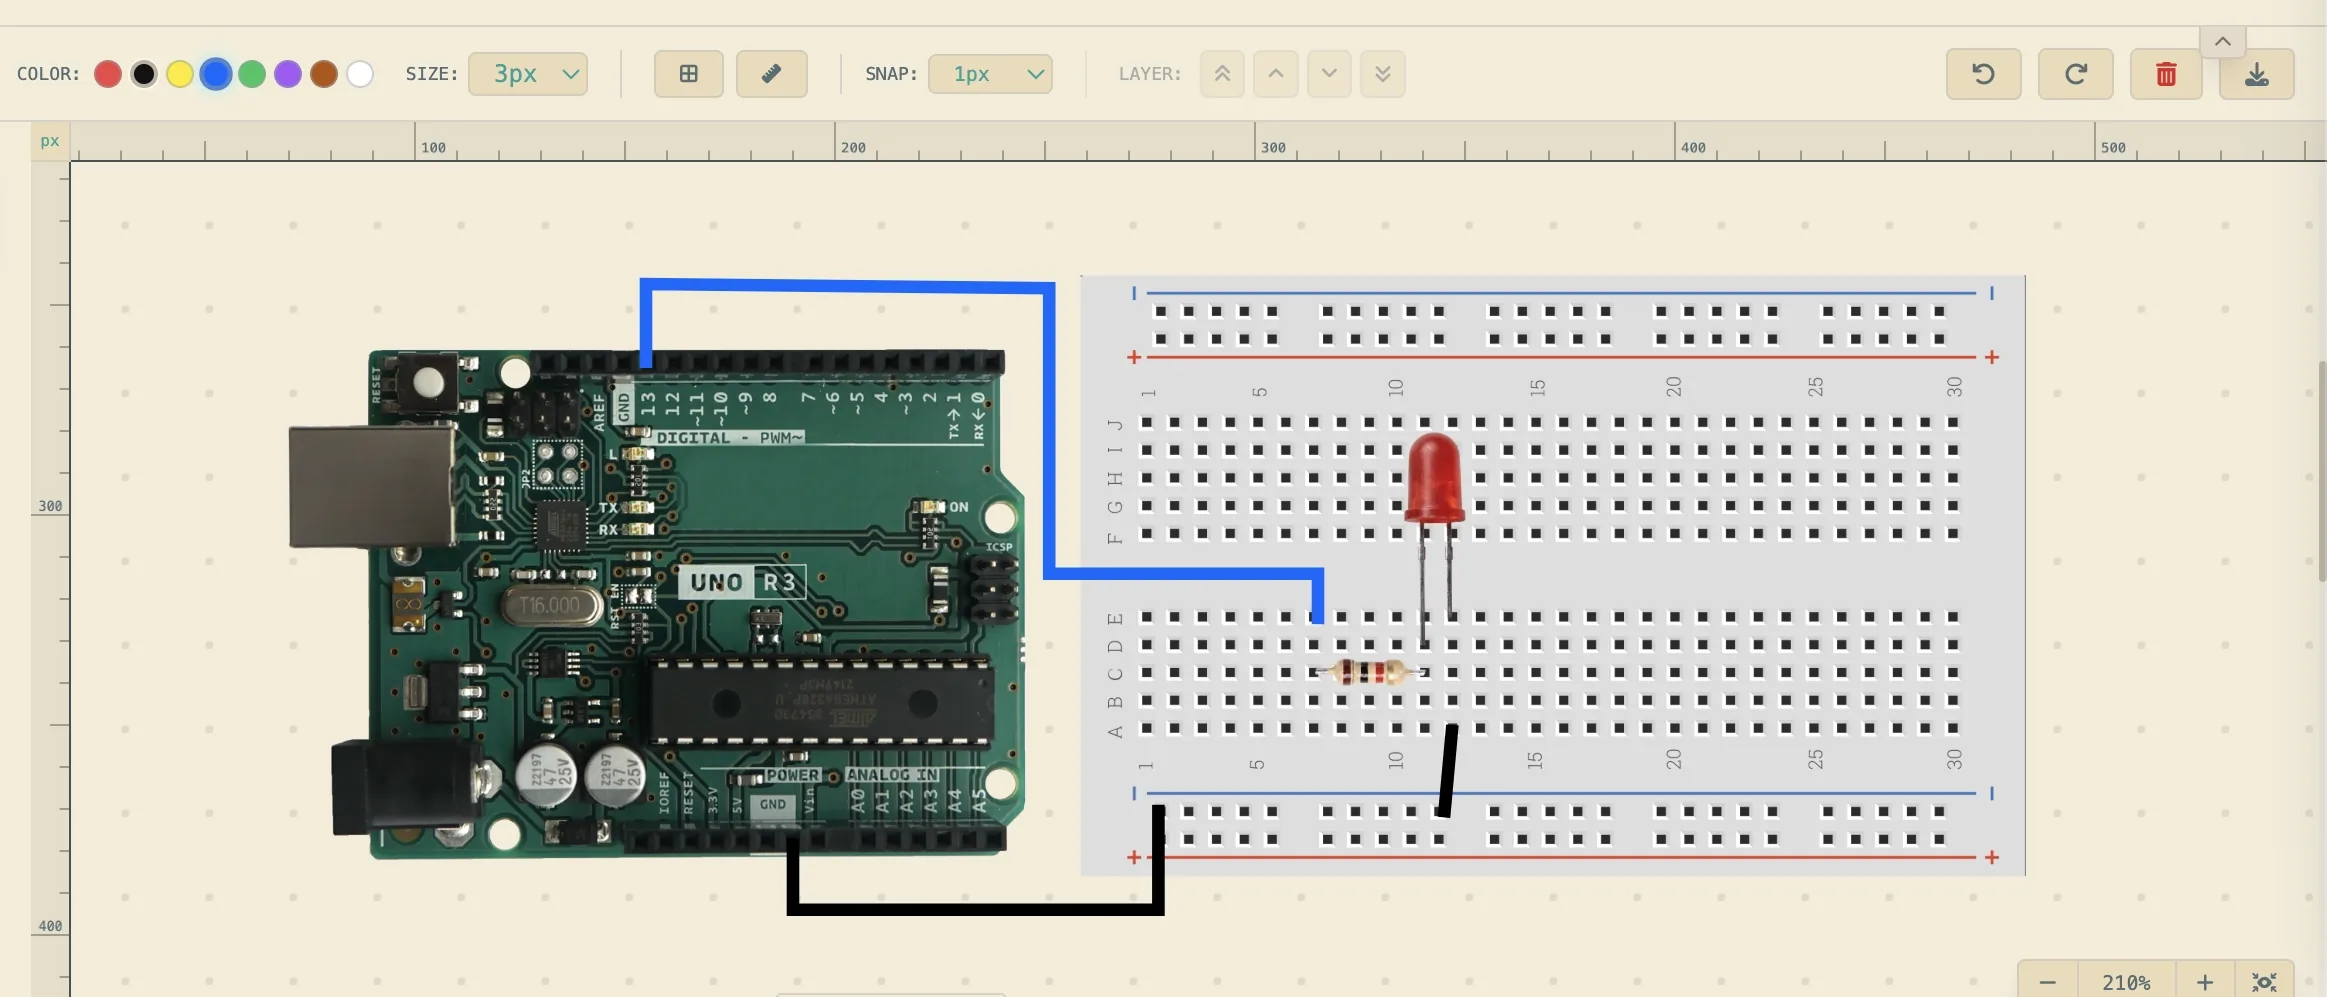
- User-Built Cutout Workflow (Image Mode & Spec Mode Sync):
VTM Studio provides starter sample images as examples while leaving the remaining library slots open (
NO IMAGE/DRAFT DESIGNplaceholders) for you to finish. Upload any part photo into Section 5:9 — Image Mode, cut it out with the Bézier tool, and save it to a category (or upload/AI-generate an image in Section 5:7 — Spec Mode), and it automatically syncs into your Layout Mode drawer ready to place on the canvas. - Point-to-Point Bézier & Orthogonal Wires: The wire tool supports three drawing styles (Bézier curves, 90° orthogonal bends, or straight connections) with multi-node anchor paths. Double-click any wire segment to insert new anchor vertices, and drag bezier control handles to sculpt wires.
- Bypass & Nudge Shortcuts: Hold the Alt (or Option) key to bypass grid-snapping for 1px sub-grid placement. Arrow keys nudge elements by 1px (or 10px with Shift).
- Aspect-Locked Corner Scaling: Drag corner handles to scale components. Hold Shift to preserve the component's original aspect ratio.
- 15px Outer Rotation Ring: Selected wrappers feature a 15px interaction perimeter ring that swaps the cursor to a curved rotation arrow, enabling 1° rotation steps (or 15° steps with Shift).
- Organized Component Categories: Dynamic library sorting divides parts into Microcontrollers, Prototyping, Inputs/Sensors, Actuators, and Power Supplies, plus custom user-created folders.
- Clipboard Duplicate: Quickly clone elements with a slight offset using Ctrl+C and Ctrl+V.
- Undo / Redo History: A full undo/redo history tracks your canvas edits for quick recovery.
You want to document your Arduino Uno, breadboard, and a custom sensor breakout board. You start with the included sample parts, then upload a photo of your sensor into Image Mode (Section 5:9), cut it out, and save it to your Sensors category. When you switch to Layout Mode, your custom sensor is waiting in the left drawer: drag your parts onto the canvas, trace vector jumper wires between pins, save the .vtml project, and export a .psd, .svg, or .png wiring diagram.
- Create or Upload Your Parts: Use the included starter sample parts, or open Section 5:9 — Image Mode to upload your own hardware photo, cut it out, and save it to a category (or upload/AI-generate a part image in Section 5:7 — Spec Mode).
- Say "open layout mode" or click the Layout Mode icon in the desktop navigation bar.
- Drag your components directly from the left library drawer onto the canvas, or click them to spawn them centered in your view.
- Click a component to select it:
- Move: Drag the component body to slide it. Positions snap to a 10px grid.
- Resize: Drag the corner handles. Hold Shift to lock the original aspect ratio, or resize freely without constraints.
- Rotate: Move your cursor into the outer 15px Interaction Ring surrounding a selected component to display the custom curved rotation cursor, then click and drag to rotate freely in 1-degree steps (hold Shift to snap by 15° increments).
- Press W or click the Pen button in the toolbar to enter Pen drawing mode.
- Click to drop straight/corner anchor nodes, or click-and-drag to pull out symmetric control handles and bend the curve. Right-click, double-click, or press Enter to place the final wire, or press Escape to cancel drawing.
- Choose wire colors (Red, Black, Yellow, Blue, Green, Purple, Brown, White) and thickness (3px to 5px) from the toolbar. You can select any placed wire and click a toolbar color swatch to dynamically re-color it.
- Save your work as a
.vtmlproject file or click Export PNG / SVG / PSD in the top toolbar to download a clean wiring diagram. - Press Ctrl+Z / Ctrl+Y to undo/redo, or press Del / Backspace to delete selected elements.
Select any placed component or wire and press Ctrl+C (or Cmd+C) followed by Ctrl+V to duplicate it with a slight offset. Hold the Alt (or Option) key while dragging components, drawing wires, or moving vertices to bypass grid snapping and achieve 1px precision. Alternatively, use the arrow keys (←↑↓→) to nudge selected items by 1px (hold Shift to nudge by 10px).
Selecting a wire reveals its blue anchor vertices. Click an anchor to view its orange control handles and dashed helper lines. By default, dragging a handle bends the curve symmetrically. Hold Alt (or Option) while dragging a handle to break symmetry (corner anchor) and create sharp curves or corners. Double-click any anchor vertex to instantly toggle it between curve and corner mode. Double-click anywhere on a wire path to insert a new vertex, or double-click a vertex to delete it. You can also select a vertex and press Delete or Backspace to remove just that point.
Cycle through canvas layouts using the Grid Toggle button in the toolbar to switch between Grid: Dots (radial dot layout), Grid: Lines (full prototyping line grid), and Grid: Off (solid canvas). The grids automatically invert to dark lines when using Solarized Light Theme to guarantee maximum drawing contrast.
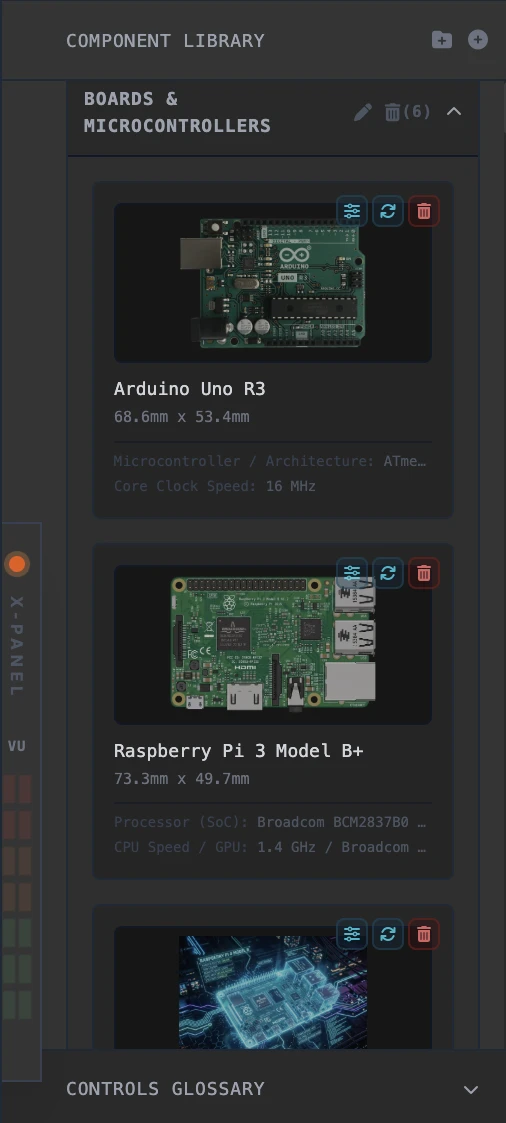
Click the + Folder button in the library header to define new custom categories. Click the + Part button to upload WebP/PNG images, set custom default dimensions, and assign categories. Natural image resolutions exceeding 220px are automatically scaled down proportionally to fit the canvas layout.
Drag component cards inside the library list and drop them onto other category header summaries to instantly reassign categories. Click the edit slider icon next to custom components to open the Edit Part Modal to update their name, category, size, or image. Custom categories can be deleted; confirming will safely re-route contained parts to a default "Uncategorized" folder. All custom parts and categories are saved locally in your workstation library so your setup persists across sessions.
For the cleanest custom cutouts, open Section 5:9 — Image Mode, upload your own photo or drawing of a component, trace and cut it out with the Bézier Pen tool, and save it to a category—it immediately appears inside Layout Mode's category drawer.
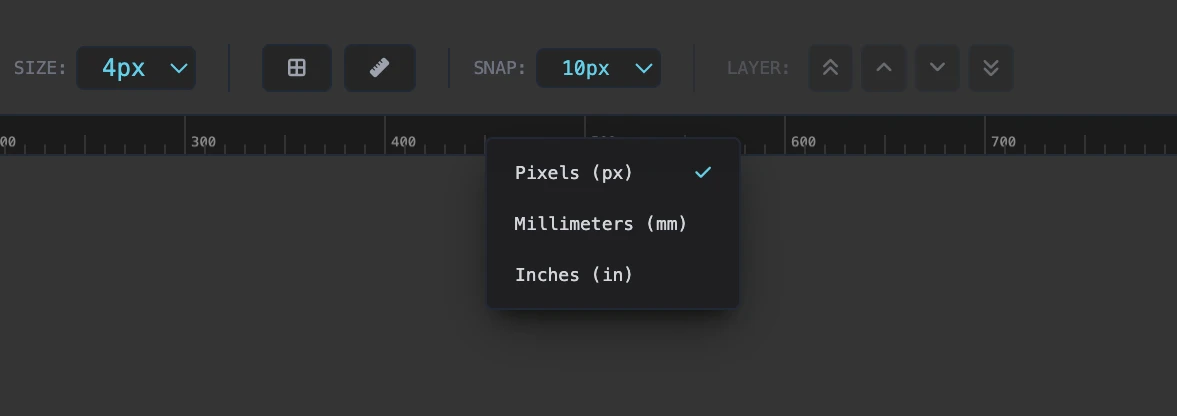
Layout Mode features responsive X and Y axis rulers to assist in sizing and arranging components. Rulers are locked into view at the top and left margins of the workspace, dynamically redrawing their tick marks and labels as you scroll or resize. Right-click any ruler or the corner intersection box to change the active measurement unit between Pixels (px), Millimeters (mm), and Inches (in). Press R or click the toolbar button to toggle rulers on or off. Hovering the canvas projects live guideline markers onto both rulers to track coordinates in real time.
Control the vertical overlap of overlapping parts using the Layer Arrange tools in the toolbar, or use standard professional editor keyboard shortcuts: press Ctrl+] (or Cmd+]) to Bring Forward (Up one layer) and Ctrl+[ (or Cmd+[) to Send Backward (Down one layer). Add the Shift key to these shortcuts to instantly Bring to Front or Send to Back.
Section 5:9 — Image Mode
Precision component cutout and Bézier vector tracing studio—where you create your own custom hardware cutouts for Layout Mode (Section 5:8) and Spec Mode (Section 5:7). While VTM Studio ships with sample images as starter examples, Image Mode lets you upload your own photos, drawings, or AI-generated images of any microcontroller, sensor, actuator, or breakout board, cut them out cleanly, and save them directly into a Layout Mode category.
You want to add your own sensor or board to your circuit layout—or fill in a component slot that currently shows a starter placeholder. You upload a photo or AI-generated image of the part into Image Mode, trace its outline with the Bézier Pen tool, adjust edge feathering, choose its category (such as Sensors or Microcontrollers), and save it. Your new cutout immediately appears inside Layout Mode under that category, ready to drag onto the breadboard canvas.
- Load Source: Upload your own hardware photo, drawing, or AI-generated part image into the Image Mode canvas.
- Bézier Pen Tool (P): Click around the part to place anchor points and draw a closed vector cutout path.
- Anchor Edit Tool (A): Reposition vertices, adjust tangent handles, and toggle smooth curves or sharp corners.
- Edge Feathering & Quality: Fine-tune boundary feathering (0–8px) for clean edges and set WebP compression quality.
- Save to Category (Syncs to Layout Mode): Enter your part name, select the target category from the dropdown, and click Send to Layout Mode—then open Layout Mode to see and place your cutout immediately.
Section 5:10 — Science Mode
Welcome to Section 5:10 — Science Mode (unlocked in the Maker Pro and Physical AI Pro packs)! This mode functions as an authentic physical instrumentation and telemetry workbench. It links physical microcontroller circuits on your breadboard with real-time software instrumentation, visualizing ambient, kinetic, and electrical measurements over high-speed USB serial and VTM Studio Lite mobile companions.
You build a physical circuit on your breadboard (such as a potentiometer wiper, light sensor, or digital switch). You flash the verified sketch in Code Mode, connect telemetry, and Section 5:10 — Science Mode ingests the live serial stream, prints unparsed RAW diagnostic proof, and drives high-contrast dials, graphs, and state indicators in real time.
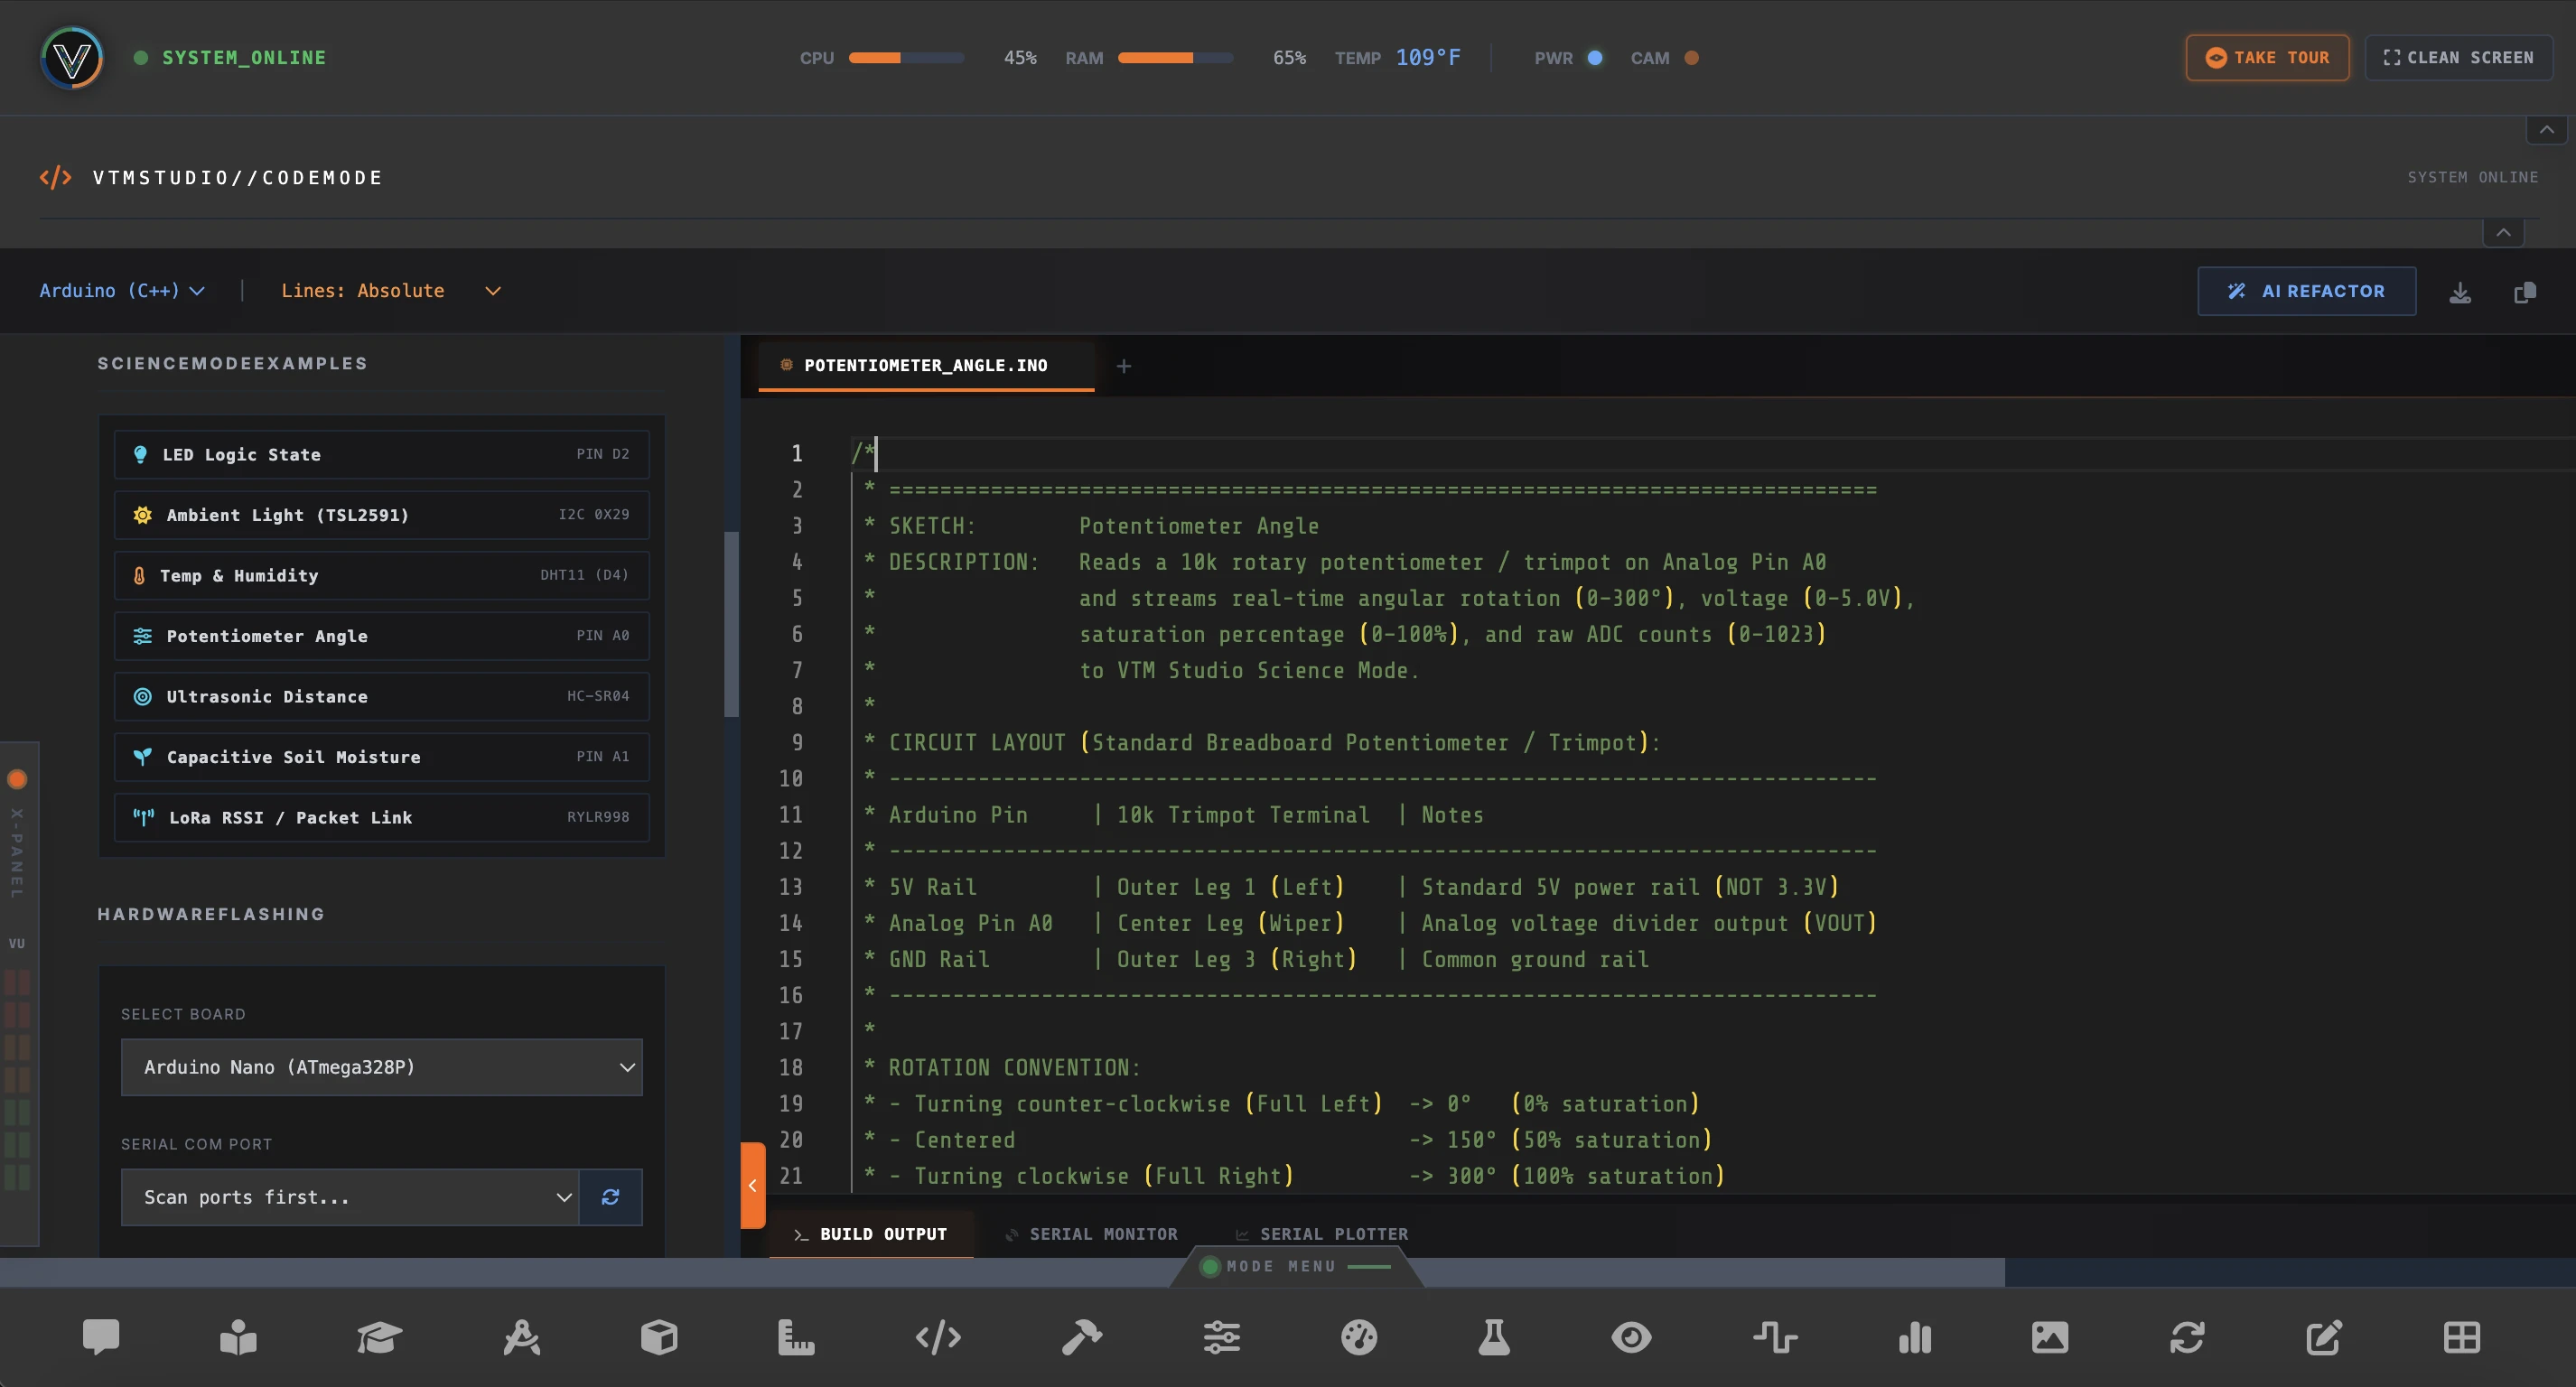
- Open Code Mode: Navigate to Code Mode on the workbench.
- Load Verified Sketch: Open the Science Mode Examples drawer and select the matching circuit sketch (complete with pin wiring table and non-blocking timing).
- Flash & Connect: Flash the sketch to your microcontroller over USB and click [CONNECT TELEMETRY].
- Launch Science Mode: Open Science Mode, click the matching panel button in the right drawer, and watch live telemetry populate your instruments.
Science Mode is built for real engineering—zero mock data, zero simulated waveforms, and zero placeholder widgets. Every panel corresponds 1:1 to an authentic physical sensor and a verified sketch in Code Mode.
- 115200 Baud USB UART Engine: Listens on active USB serial ports, parsing real microsecond telemetry packets from Arduino, STM32, ESP32, or Raspberry Pi Pico microcontrollers.
- 1:1 Hardware Parity: Verified pre-built instruments include Ambient Light (TSL2591), LED Digital State (Pin D2), Potentiometer Angle (Pin A0), Capacitive Soil Moisture (Pin A1), Ultrasonic Distance (HC-SR04), and LoRa Packet Link (RYLR998).
- The RAW Line Contract: Every panel displays a live monospace
RAW:diagnostic readout displaying the unparsed serial string directly from the wire. If the wire is disconnected, telemetry halts truthfully. - In-Panel Setup Guides: Every instrument card features an integrated wiring reference showing required voltage rails, ground returns, and analog/digital pin assignments.
- Layout History: Save custom multi-panel workbench configurations, duplicate setups, rename layouts inline, and restore them with one click. Export logged datasets directly to CSV or JSON offline reports.
Serial.println("{\"lux\":420,\"voltage\":3.30,\"pot_angle\":180}");
Serial.println("lux:420,voltage:3.30,pot_angle:180");
val_1, val_2, etc.):Serial.print(420); Serial.print(","); Serial.println(3.30);
Serial.println(3.30);
The Universal Telemetry & Key Snippet System
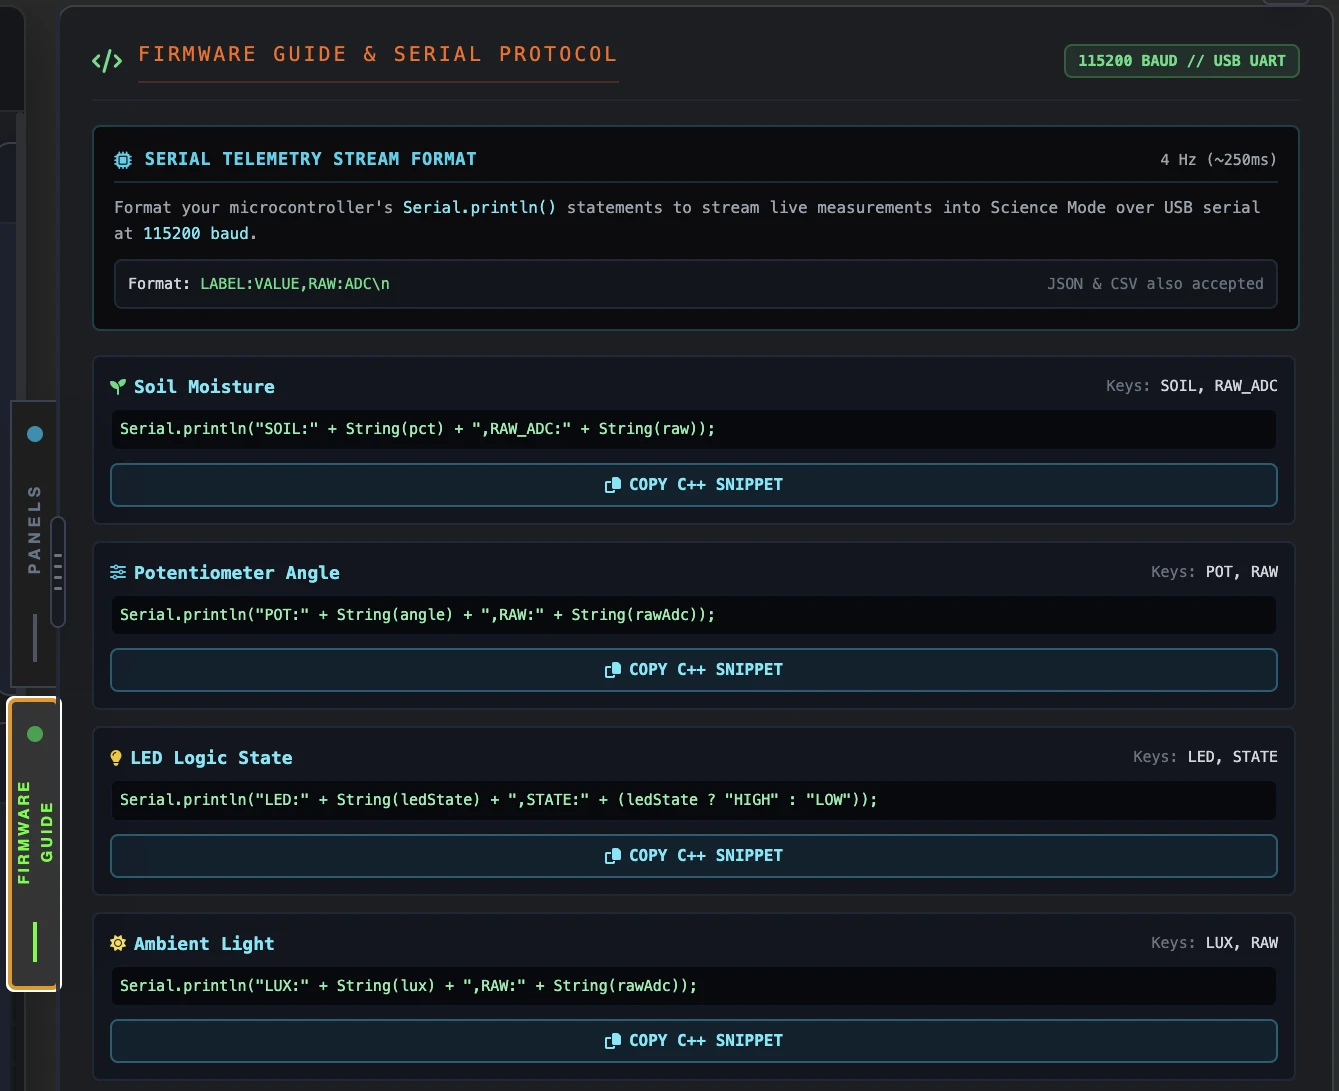
Science Mode decouples physical breadboard computing from software visualization. You don't need custom desktop software or complicated communication libraries for every sensor. Instead, VTM Studio provides a universal 115200 baud key protocol: drop a single formatted Serial.println() statement into your existing Arduino sketch, and Science Mode instantly mounts and animates your circuit instruments in real time.
Transforms any microcontroller (Arduino Uno, Nano, STM32, ESP32, Raspberry Pi Pico) into an active telemetry node streaming engineering metrics and raw ADC signals at 4 Hz (~250ms).
Eliminates manual protocol coding and breadboard fatigue. Makers can build any circuit from standard starter kits and 37-in-1 modules using their own sketches, dropping in pre-mapped telemetry keys with zero friction.
Every panel features a live monospace RAW: line. This unparsed readout proves physical continuity, verifies sensor thresholds (air vs water, dark vs light), and exposes true hardware state with zero simulated illusions.
Wire your sensor to your microcontroller using any standard tutorial pinout, or open your existing working sketch in Code Mode.
In Science Mode, open the right drawer and switch to FIRMWARE GUIDE. Find your sensor and click [Copy C++ Snippet].
Paste the single line into your sketch's loop(). Flash at 115200 baud, add the matching panel on the canvas, and watch authentic physical telemetry animate.
Telemetry is streamed as a single comma-separated text line terminated by a standard newline (\n). Each line carries a primary calculated metric followed by the raw ADC or pulse count:
Whether using a 10-bit Arduino Nano (0–1023) or a 12-bit ESP32 / Arduino Uno Q (0–4095), Science Mode automatically senses your board's resolution. Raw values exceeding 1023 scale cleanly against 4095, preventing 400% dial saturation and needle clipping.
[COM] indicates verified workstation circuits tested on physical hardware.
[BETA] indicates open starter kit and 37-in-1 kit sensor panels adhering to universal key contracts, ready for maker workstation verification.
Transform any mobile device into an auxiliary sensor node. By connecting to the local VTM Studio Lite companion app, 14 onboard smartphone sensors stream live physical telemetry directly to your workbench over WebSockets.
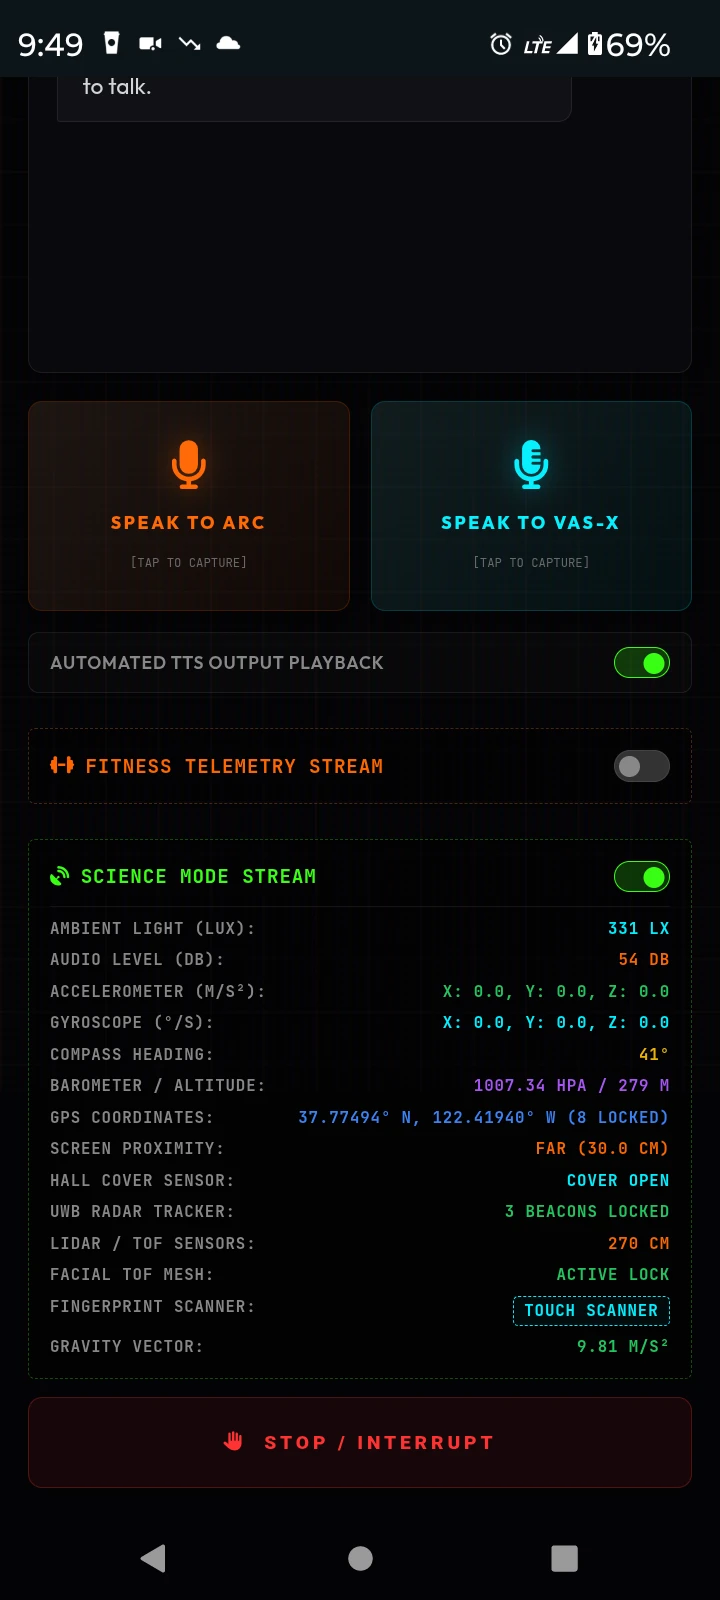
- Mobile Lux Meter: Circular ambient luminance gauge reading ambient phone light sensor lux.
- 3-Axis Accelerometer & Gyroscope: Real-time Accelerometer, Gyroscope rotation rates, and Gravity pull vectors streaming at 10Hz.
- Environmental & Acoustic: Real-time Sound Decibel (dB) levels driving VU meters, Barometric pressure, and GPS coordinates.
- Spatial & Biometrics: Compass Magnetometer heading, ToF Face, Hall Effect, UWB, and LiDAR depth tracking.
- Tier Availability: Science Mode is included in the Maker Pro and Physical AI Pro packs; mobile companion instrumentation pairs with VTM Studio Lite in the upcoming Go bundles.
Ready-To-Flash Example Sketch (Code Mode Parity)
Center Wiper → Analog Pin A0
Outer Pin 3 → GND rail
KEY:VALUE pairsKeys:
pot (0–1023), volts (0.00–5.00V), deg (0–300°)
millis() with zero blocking delay() calls.
/*
 * VTM STUDIO — SCIENCE MODE TELEMETRY SKETCH
 * SKETCH:       Potentiometer Angle & Voltage Monitor (Pin A0)
 * HARDWARE:     10kΩ Potentiometer (Outer Leg 1 -> 5V, Outer Leg 3 -> GND, Center Wiper -> A0)
 * TELEMETRY:    115200 Baud | Format: KEY:VALUE | Key: pot (0-1023), volts (0.00-5.00V), deg (0-300)
 * ATTRIBUTION:  Prompted by Tishin Padilla (VideotronicMaker) | Generated by Gemini 3.8 Flash
 * LICENSE:      Public Domain / Open Source
 */

const int POT_PIN = A0;
unsigned long lastTelemetryTime = 0;
const unsigned long TELEMETRY_INTERVAL = 100; // 10 Hz non-blocking loop

void setup() {
  Serial.begin(115200);
  while (!Serial) { ; } // Wait for native USB if needed
}

void loop() {
  unsigned long currentMillis = millis();

  // Non-blocking timer loop (zero delay calls)
  if (currentMillis - lastTelemetryTime >= TELEMETRY_INTERVAL) {
    lastTelemetryTime = currentMillis;

    // Read real physical wiper voltage
    int rawAdc = analogRead(POT_PIN);
    float voltage = (rawAdc * 5.0) / 1023.0;
    int angle = map(rawAdc, 0, 1023, 0, 300);

    // Stream structured telemetry packet matching Science Mode panel
    Serial.print("pot:");
    Serial.print(rawAdc);
    Serial.print(",volts:");
    Serial.print(voltage, 2);
    Serial.print(",deg:");
    Serial.println(angle);
  }
}
Section 5:11 — Vision Mode
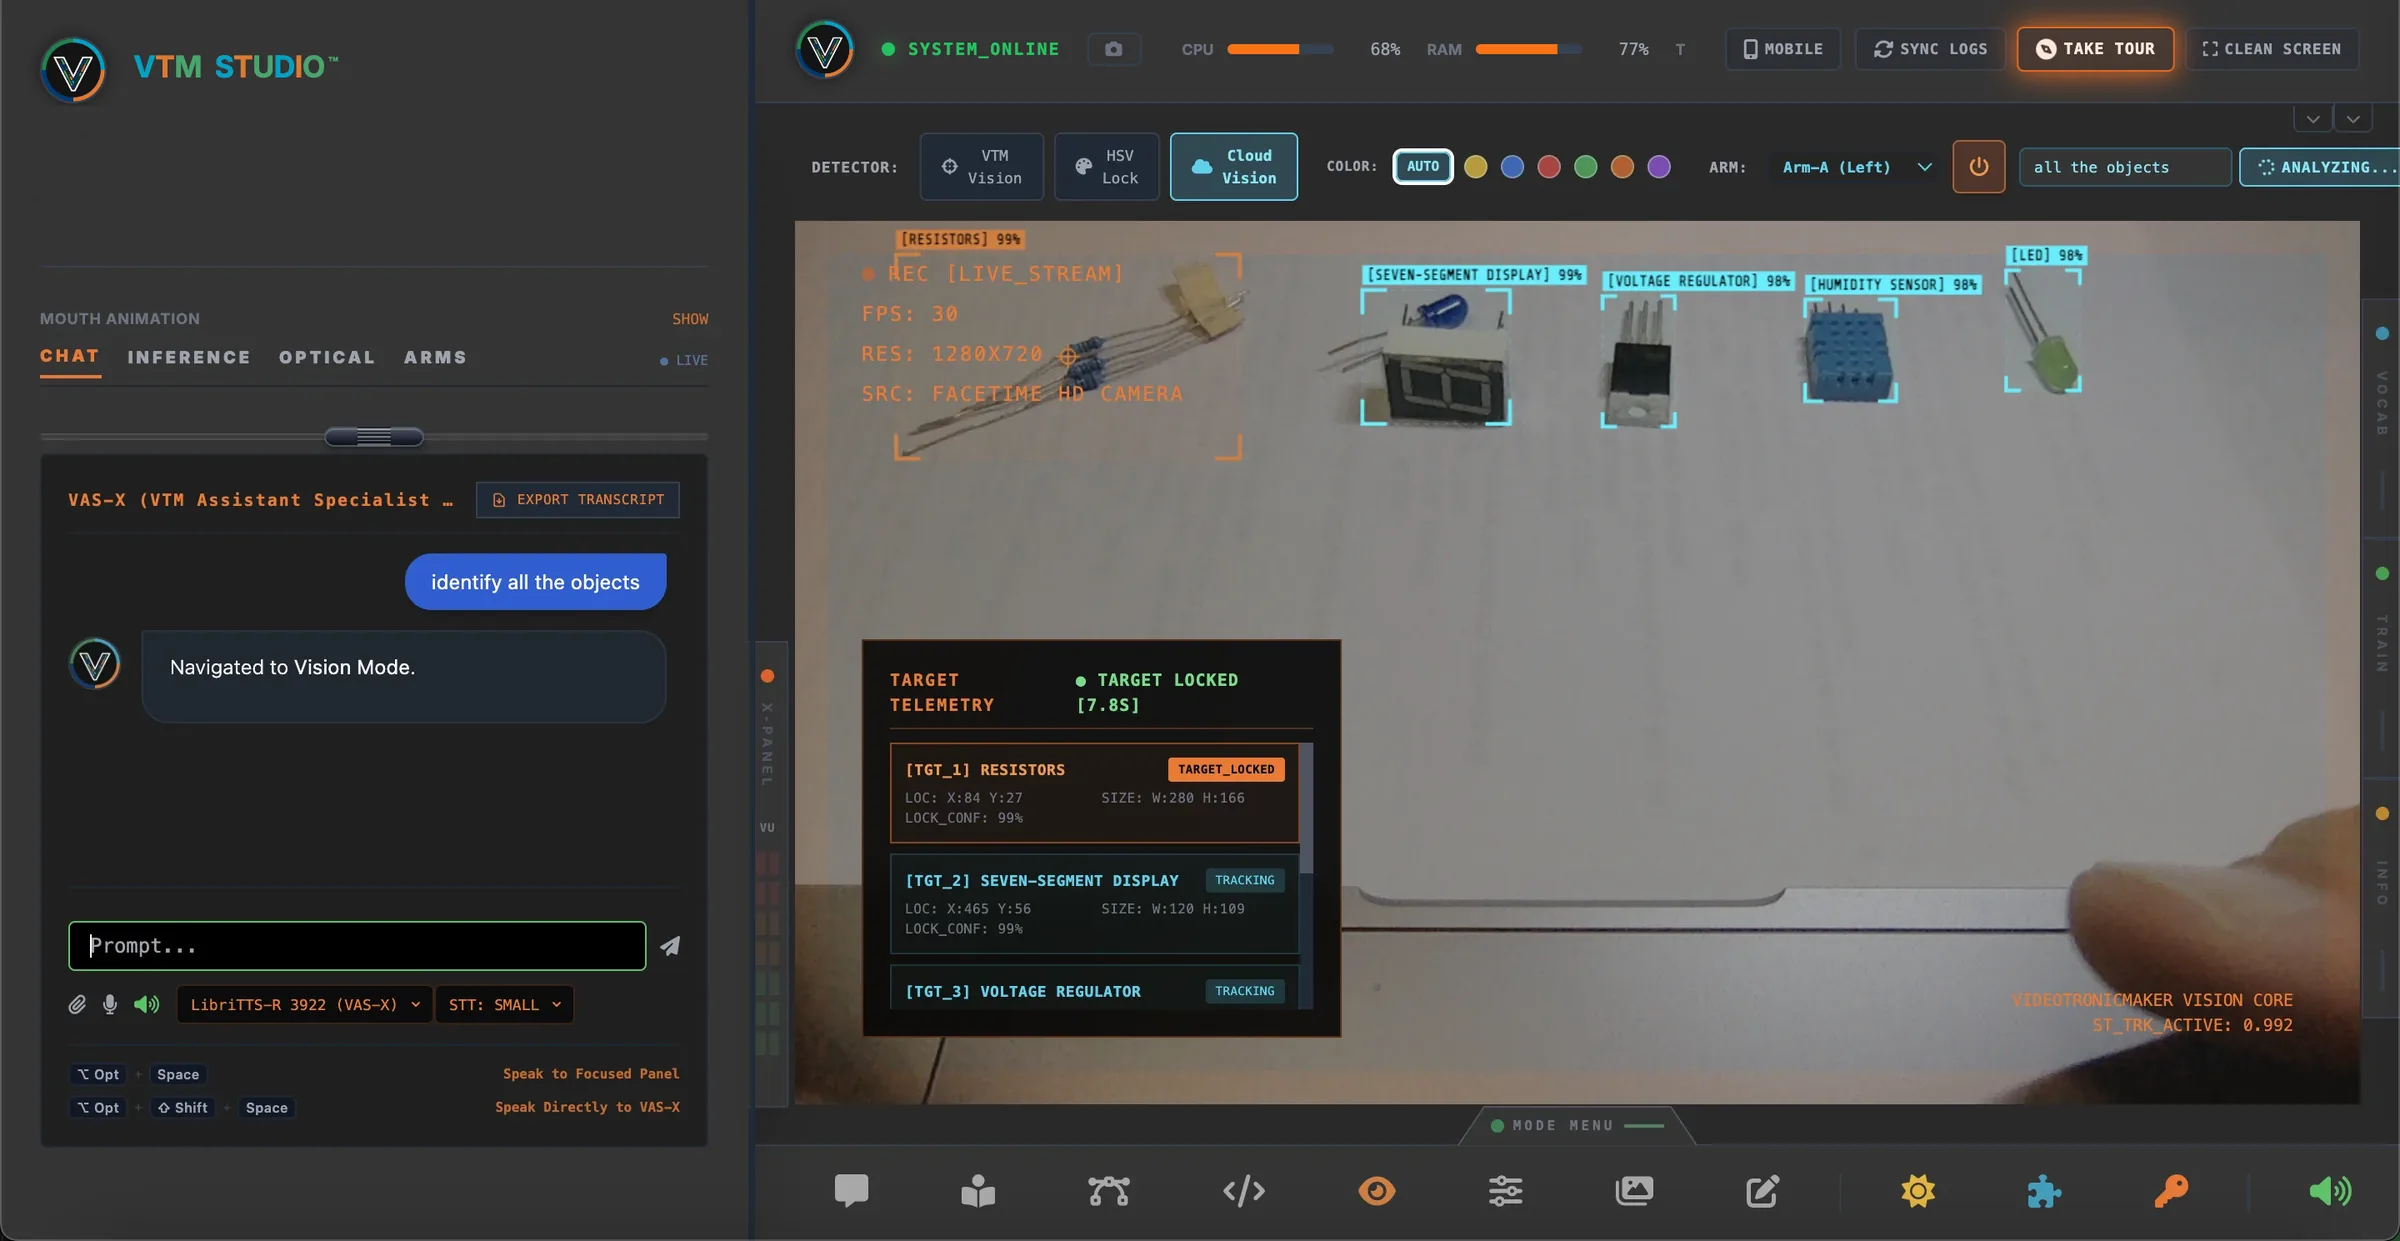
Section 5:11 — Vision Mode connects live camera feeds to 3 detector engines—VTM Vision (local real-time object detection on Mac and Windows), HSV Lock (real-time color blob tracking), and Cloud Vision (prompt-driven AI frame analysis in Physical AI Pro)—giving your workstation live object detection, color tracking, and servo coordinate sync.
You are assembling a circuit on your workstation and need to locate a component or track a colored target. You type a target name into the prompt bar or ask VAS-X "find the transistor" — Vision Mode captures the camera frame, plots bounding box corner brackets with confidence scores, locks target telemetry, and optionally streams X/Y coordinates to your connected servo hardware.
- Cloud Vision Engine (Physical AI Pro): Prompt-driven Cloud AI vision processing analyzes camera frames for specific electronic parts and objects.
- Top HUD Target Prompt Field: Type any electronic part name directly into the top control bar input for optical search ("transistor", "yellow comb", "green led").
- VAS-X Voice Target Acquisition: Ask VAS-X "find the transistor" or "where is the green led" — it auto-populates the prompt, switches to Cloud Vision, and executes frame analysis automatically.
- Smart Contextual Engine Routing: Automatically respects your active detector engine — selects matching color swatches in HSV Lock mode ("find the red block") versus running Cloud Vision analysis in Cloud Vision mode.
- Live TARGET TELEMETRY Acquisition Timer: Bottom-left HUD timer pulses while scanning (
● SCANNING [0.4s]) and turns solid green once your target is locked (● TARGET LOCKED). - Wall-To-Wall Panoramic Viewport: Full-width edge-to-edge optical display canvas with zero letterboxing for camera streams.
- 3 Optical Detector Engines: Switch between VTM Vision (local real-time object detector on Mac/Win), HSV Lock (fast color & blob tracker with AUTO and 6 target color swatches), and Cloud Vision (prompt-based AI vision in Physical AI Pro).
CAM:Hardware Source Selector: Switch between built-in webcams, external USB UVC cameras, and free Android phone cameras (via Iriun Webcam over Wi-Fi/USB for Android 11/12+ or native Android 14+ USB Webcam mode) with hot-plug detection, saved device preference, and automatic unplugged fallback.- 4-Mode Robotic Arm Target Sync: Route live spatial X/Y target coordinates to physical servos (
Disabled,Arm-A Left,Arm-B Right,Dual Arms). - Pop-Out Reference Side Panels: Slide open VOCAB (Active Vocabulary dictionary) and INFO (Vision Mode guide).
- Click the orange Power icon on the top HUD bar to boot your camera stream, and use the
CAM:dropdown to select your built-in camera, external USB webcam, or connected Android phone camera. - Type a target part name into the HUD prompt field, or speak directly to VAS-X: "find the green led".
- Watch the bottom-left TARGET TELEMETRY timer count up while scanning and lock green upon target acquisition.
- Select Arm Target Sync (
Arm-A Left,Arm-B Right, orDual Arms) to stream X/Y coordinates directly to physical servo motors. - Pop open the side panels to inspect supported object classes or view Vision Mode guide instructions.
Section 5:12 — Code Mode
Embedded firmware IDE and physical telemetry workstation featuring the Monaco code editor, AI Refactor, Science Mode Examples, arduino-cli Verify & Flash, and a built-in serial monitor and waveform plotter.
You need to write, compile, and flash C++ firmware to an embedded microcontroller, or wire a breadboard circuit and feed live serial telemetry directly to Science Mode instruments. You write code in the Monaco editor, load verified circuit sketches or robot routines, flash the target board via arduino-cli, and stream live serial data to the waveform plotter and telemetry monitors.
- Monaco Code Editor: Multi-language syntax highlighting (C++, Python, Markdown), multi-tab file strip, line number styling (Absolute, Relative, Hexadecimal), and direct AI Refactoring.
- Science Mode Telemetry Bridge:
1-click loading for verified physical telemetry sketches (LED State, TSL2591 Light, DHT11 Temp/Humidity, Potentiometer, Ultrasonic Distance, Soil Moisture, LoRa Link) paired with the
[Connect Telemetry]serial bridge. - Project Workspace & Document Control:
Load and save host filesystem project directories, and generate new
.ino,.cpp,.h,.py, and.mdfiles directly into custom project folders. - Markdown Preview Studio: Built-in GFM preview canvas to draft, read, and preview README files and circuit notes alongside code.
- Arduino-CLI Verify & Flash Toolchain:
Integrated compiler and uploader executing
arduino-clifor AVR, ARM/STM32, ESP32/ESP8266, and RP2040 microcontroller targets. - Starter Template Library: 1-click starters for Universal Robot Arms (MG90S PCA9685, ESP32, Raspberry Pi), AI integration templates, and hardware circuit sketches (Blink, Serial, Pullup, Animatronic Mouth, IR Car, Fingerprint).
- Diagnostic Console & Plotter: Resizable 3-tab bottom tray featuring Build Output logs, real-time Serial Monitor, and a Waveform Plotter canvas with dynamic Y-axis overlays.
- Dual-Brain Hardware Reference: Dedicated MPU and MCU visual reference slots with custom schematic image upload support.
- Audio Feedback: Mechanical typewriter keystroke sounds and built-in voice readback for compilation sizing, flash verification, and serial status.
- Open Code Mode and select your target programming language (C++ or Python) and line number preference.
- Choose your board from the board selector (supporting Arduino AVR, 32-bit ARM/STM32, ESP32/ESP8266, and RP2040 Pico) and scan for active USB ports.
- Load a sketch from the sidebar—either from "Science Mode Examples", "Robot Arm", or "Hardware", or load an existing project directory from disk.
- Click "AI Refactor" to clean or adapt the routine, or edit functions directly inside the Monaco code editor.
- Click "Verify" to compile via
arduino-cli, or "Flash" to upload firmware to the connected microcontroller with real-time voice feedback. - Click "[Connect Telemetry]" to stream live UART data into the Serial Monitor and Waveform Plotter, or jump directly into Science Mode to view live physical instruments.
Section 5:13 — Audio Mode
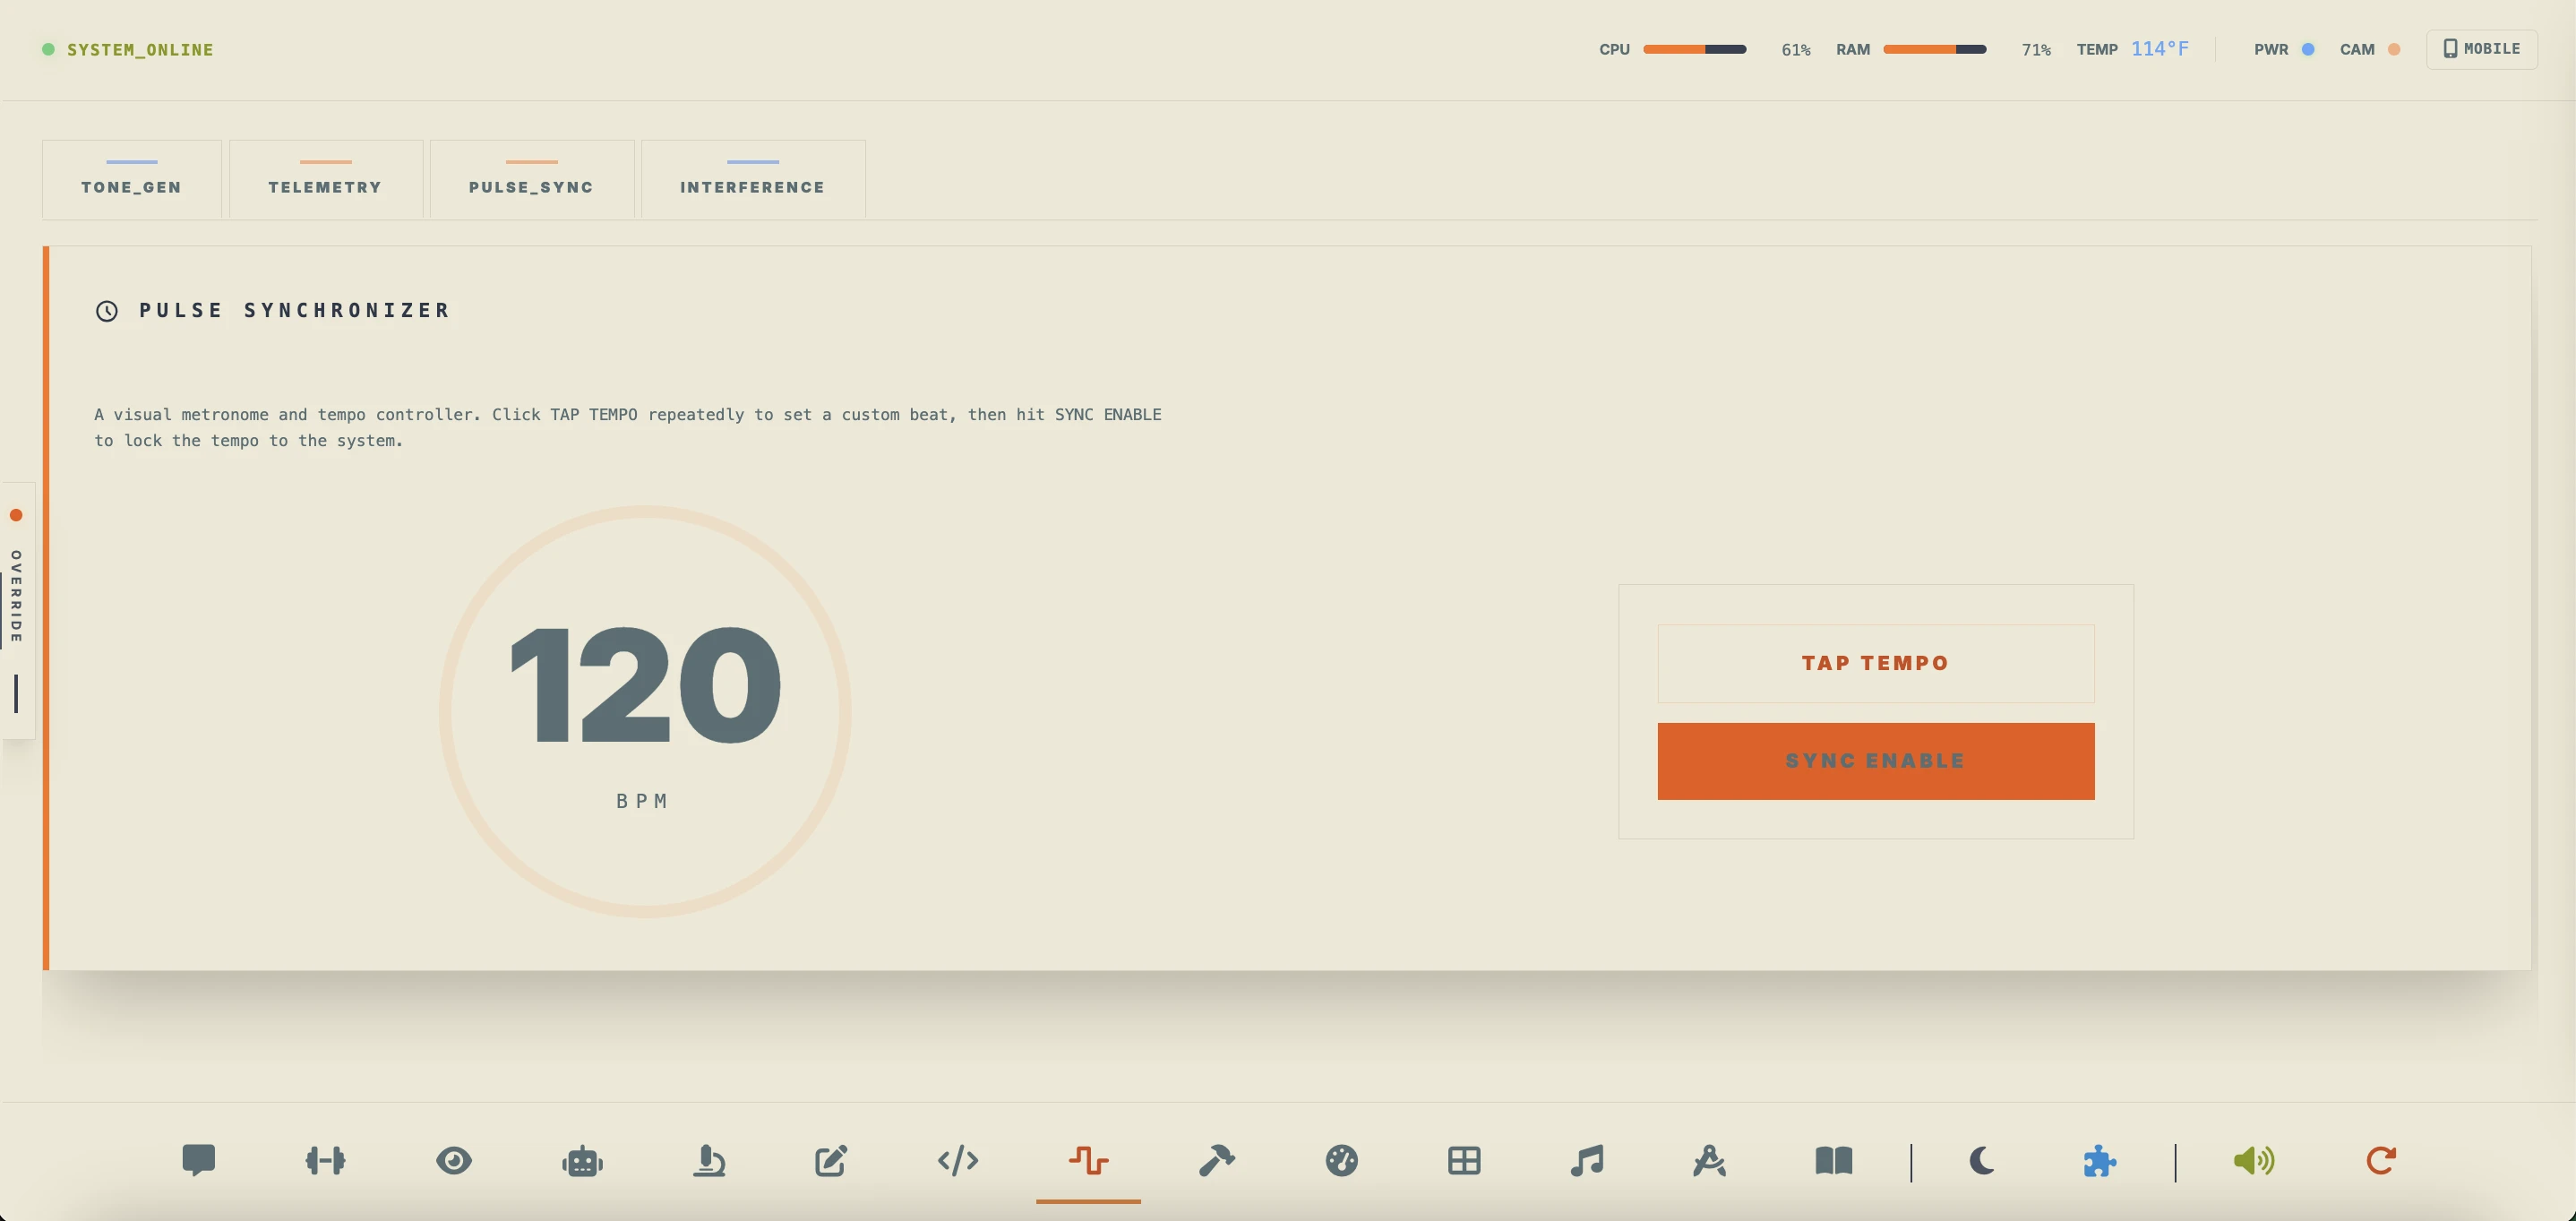
Diagnostics, real-time signal generation, and acoustic telemetry suite to test microcontrollers, piezo buzzer melodies, and input frequencies. Routes actual analog input or microphone data directly to visualizers and telemetry packets.
You are building a custom piezo buzzer alert or metronome circuit. You generate tones, write RTTTL tunes, check metronome timing calculations, and instantly export target microcontroller code (Arduino or ESP32) directly to your Code Mode Editor buffer in Section 5:12 — Code Mode.
- Select input source: Internal Synth or live computer Microphone / Line-In.
- Choose target waveforms (Sine, Square, Triangle, Sawtooth) and adjust sliders.
- View frequency bands and domain curves in the real-time Oscilloscope and FFT spectrum canvases.
- Select a tune from the RTTTL Melody Library to play it and generate buzzer frequency arrays.
- Convert tap-tempo BPM timing parameters into non-blocking
millis()interval loop code. - Click Send to Section 5:12 — Code Mode to forward scripts directly to the IDE editor buffer.
Section 5:14 — Maker Log Mode
Unified engineering journal and breadboard wiring ledger. Organize research sessions into distinct mission folders, logging progress updates, voice memos, and hardware logs.
You are logging a hardware design iteration. You create a log folder, dictate progress notes via local audio, and attach snapshots of your circuitry logs.
- Create specific "Mission Folders" to organize research projects.
- Use the WYSIWYG Editor (configured with the Visual Studio Dark theme) to write rich text notes, format typography, insert code blocks, and apply custom color-coded highlights.
- Click the voice recorder to dictate audio notes (built-in speech-to-text dictation).
- Attach screenshots, circuit diagrams, or photos directly to observation drafts.
- Export drafts directly to local system markdown folders.
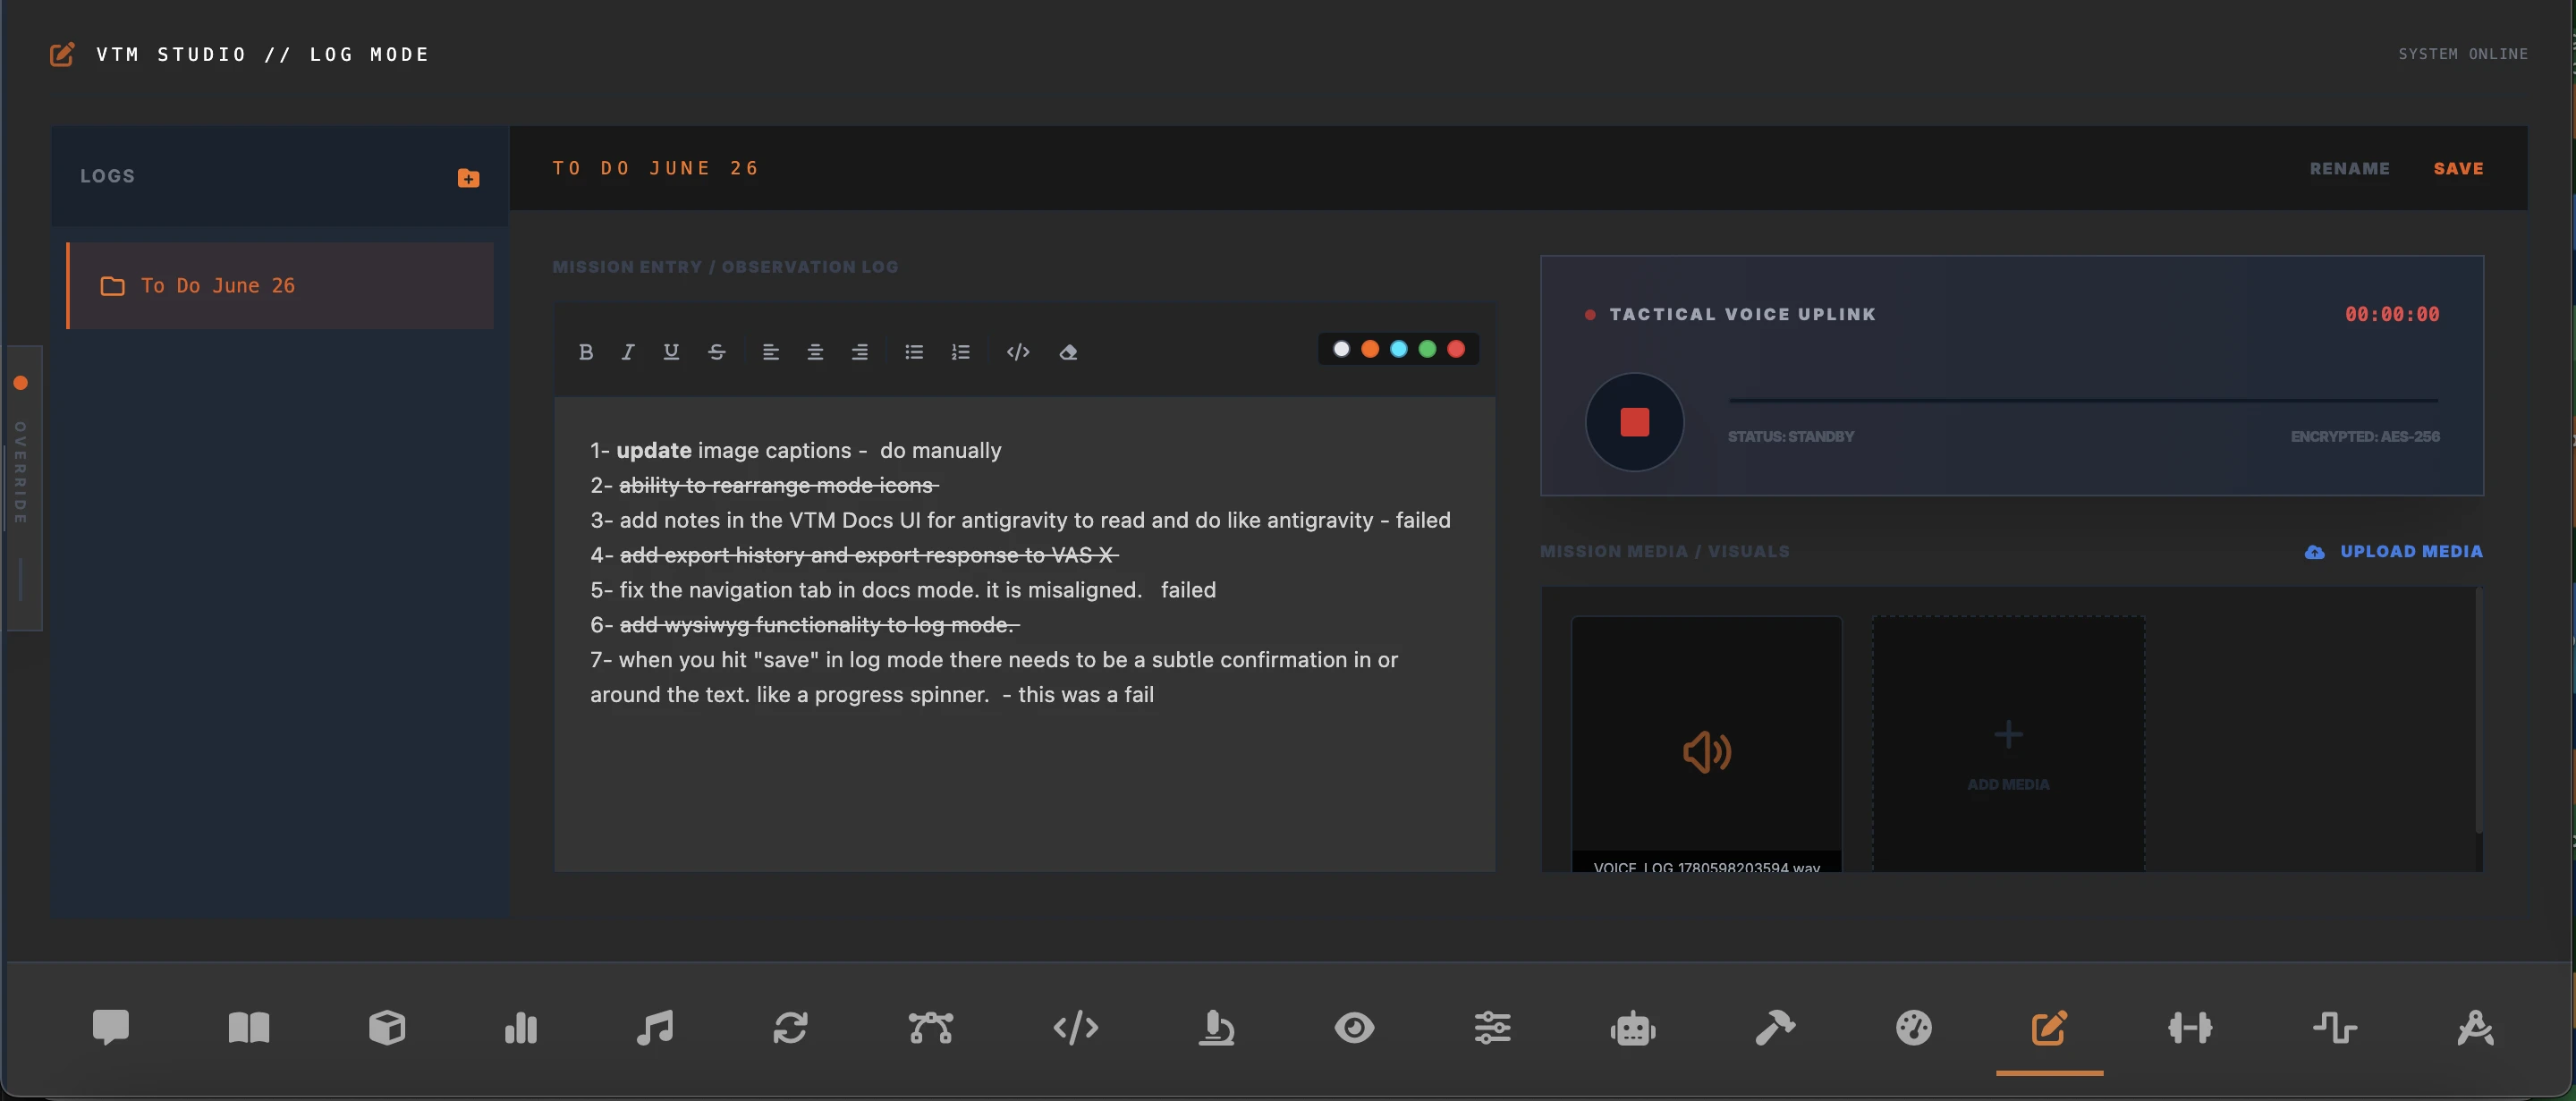
Section 5:15 — Favorites Mode
High-fidelity bookmark workspace and resource link launcher. Designed to load distributor sites, local datasheet archives, and code repositories instantly.
You need to verify the pinouts of a microcontroller. You click the local datasheet link in Section 5:15 — Favorites Mode to view a cached layout without searching the web.
- Add custom bookmarks by specifying names and external URLs.
- Click locally cached microchip specifications (e.g. ATmega328P, ESP32) for offline viewing.
- Use the app grid to launch external visualizer platforms (Circuito.io, Tinkercad, Fritzing).
- Organize links by engineering tags (e.g. #cad, #datasheet, #learning).
Section 5:16 — Music Mode
Local media player, multi-folder playlist organizer, and real-time audio equalizer with multi-select file import, direct OS Finder drag-and-drop, inline folder creation, and an auto-suspending FFT frequency spectrum visualizer.
You are organizing reference tracks and diagnostic audio logs during a long build session. You drag multiple WAV and MP3 files directly from Finder into custom playlist folders, fine-tune the Bass and Treble EQ sliders, and send selected recordings directly to Mixer Mode for mastering.
- Click Import or drag and drop multiple
.mp3and.wavfiles from Finder onto[ DROP AUDIO HERE // ROOT ]or any folder row. - Click New Folder to type a folder name inline (press Enter to create) and drag tracks between folders to organize.
- Calibrate the Bass and Treble sliders (-12 dB to +12 dB) and monitor the live FFT spectrum canvas (which auto-suspends when paused or switching modes).
- Click [Mix] on any track row to route it straight into Mixer Mode for loudness normalization or gain mastering.
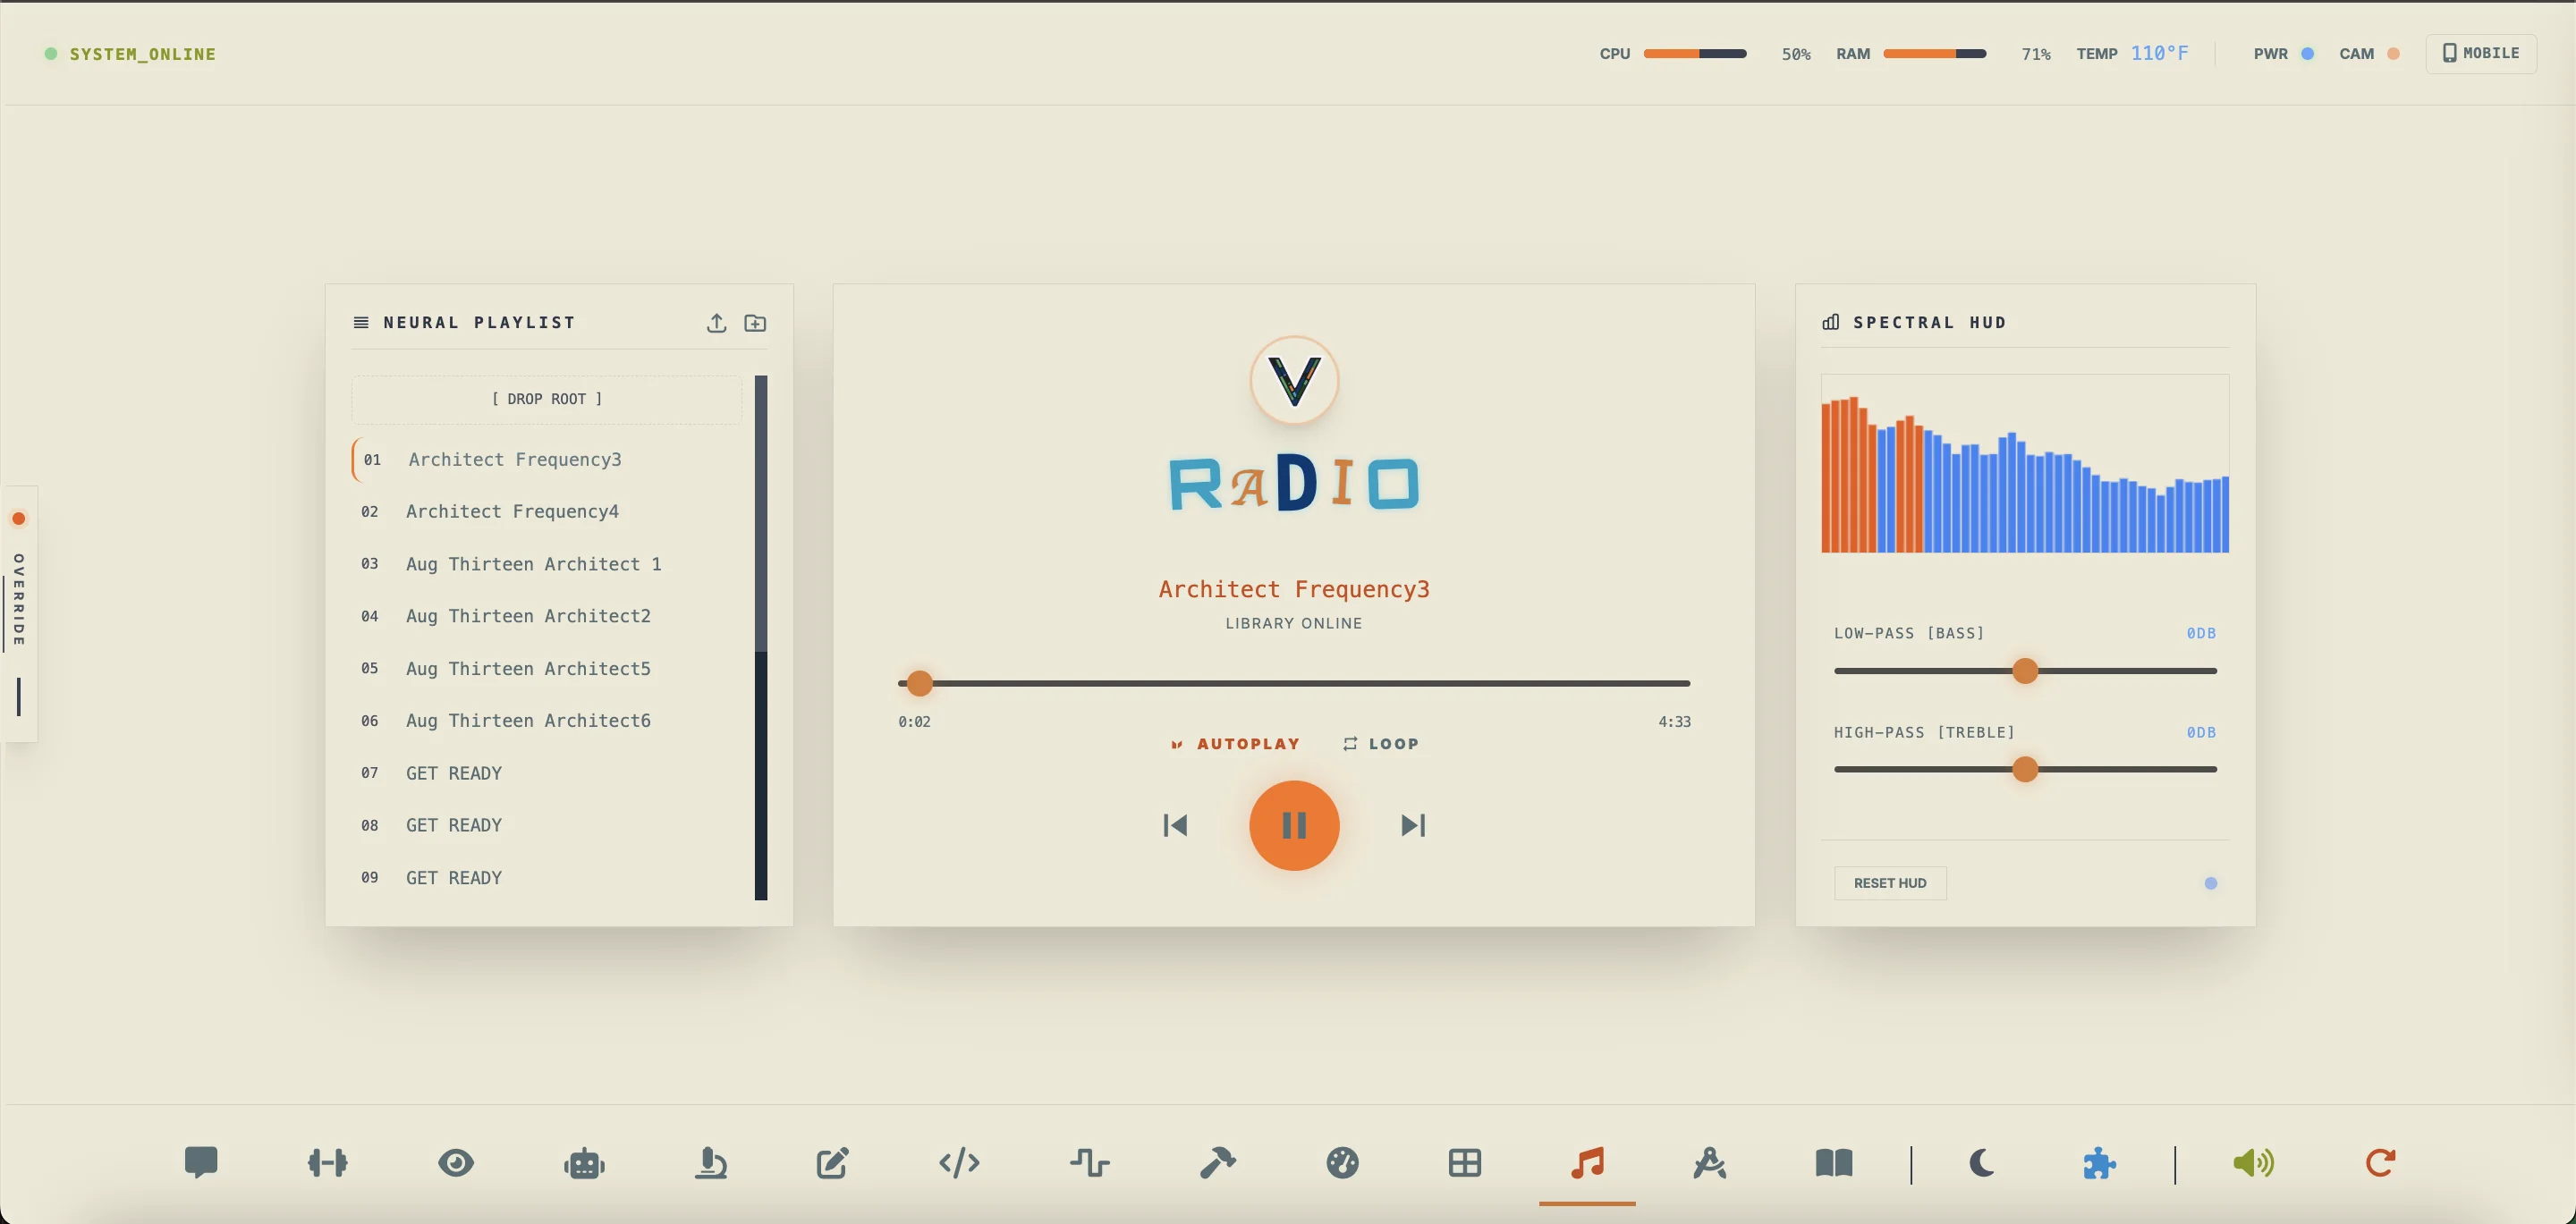
Import .mp3 or .wav files directly using
the Import button, drag files from Finder into the playlist panel or onto
any folder row, or place files inside the static/music/ directory.
Section 5:17 — Mixer Mode
Pro audio loudness normalizer, manual decibel gain mastering console, and real-time spectral telemetry workspace featuring independent left/right scroll columns, collapsible control panels, per-track playhead scrubbers, non-destructive rendering, and individually drag-resizable RTA, stereo Peak VU, and terminal log displays.
You need to master a batch of recorded voiceovers and test tones to a uniform broadcast level without overwriting your original files. You batch-import your tracks, audition them with the per-track playhead scrubbers, dial in a precise numeric dB offset or run EBU R128 normalization, and export the mastered copies.
- Multi-select or drag and drop
.wavand.mp3files into the upload zone, then use each card's playhead bar (Play/Pause, Stop & Reset to 0:00, -5s/+5s nudges, scrub slider, and liveMM:SS / MM:SStimecode) to audition tracks. - Enter an exact decibel value in the Manual Gain Offset numeric
input (
-96.0to+15.0 dB), drag the gain slider, or click [0 dB] to reset unity gain in real time. - Click [Norm] (EBU R128 double-pass
-16.0 LUFS) or [Gain] to render a non-destructive mastered copy into your library, then click [Save] to export the file to disk. - Click the Eye-Slash icon to hide any card from the list (or [show all] to restore), and collapse left panels or drag-resize the right-hand RTA, Master Peak VU, and Terminal Log displays to customize your layout.
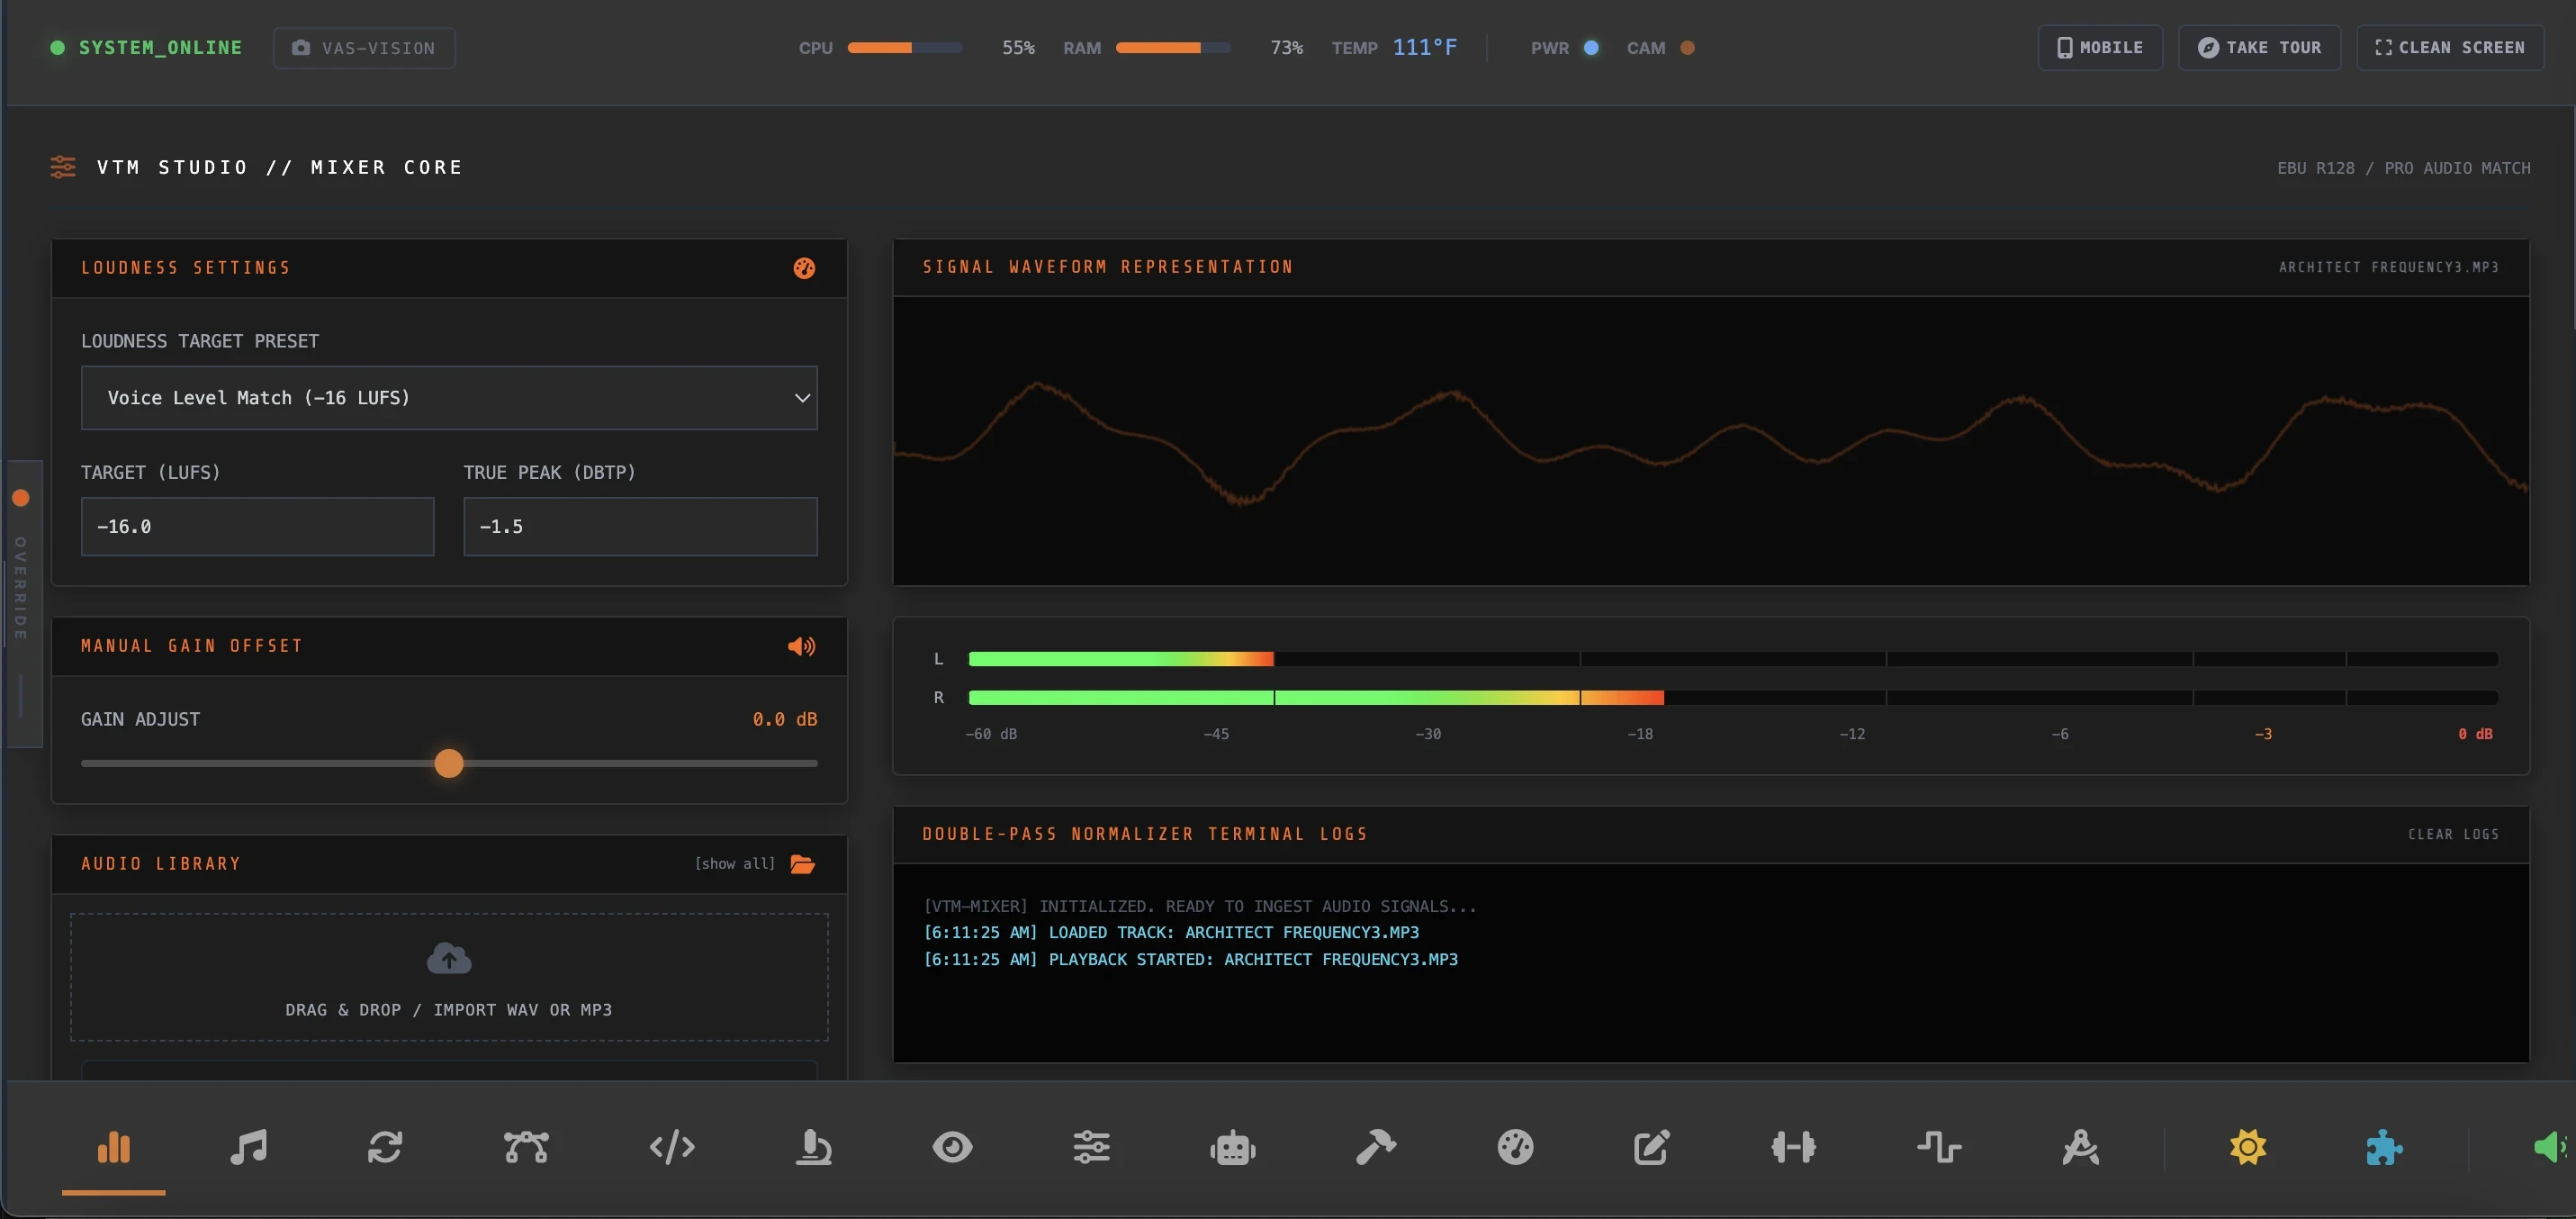
Section 5:18 — Reference Mode
Interactive dashboard containing mechanical and physical engineering reference calculators, thread guides, board schematics, wire tables, and components spec sheet databases.
You are selecting a resistor for an LED link. You check the band colors in the decoder to identify its resistance rating, verify the calculations using the 4-band/5-band equations, and use the Wattage guide to select the right package size (1/8W, 1/4W, 1/2W, etc.) to handle the current.
- Tap color bands to calculate resistor values and tolerance percentages.
- Check the **Resistor Color Band Math** sections to learn 4-band and 5-band calculation equations.
- Consult the **Resistor Wattage Guide** to choose appropriate power limits (1/4W standard, 5W shunts, etc.).
- Enter values (V, I, R, P) in the Ohm's Law calculator to compute missing parameters.
- Search the symbol dictionary to view specifications and schemas of components.
- Map resistor tolerances to standard manufacturer drawers.
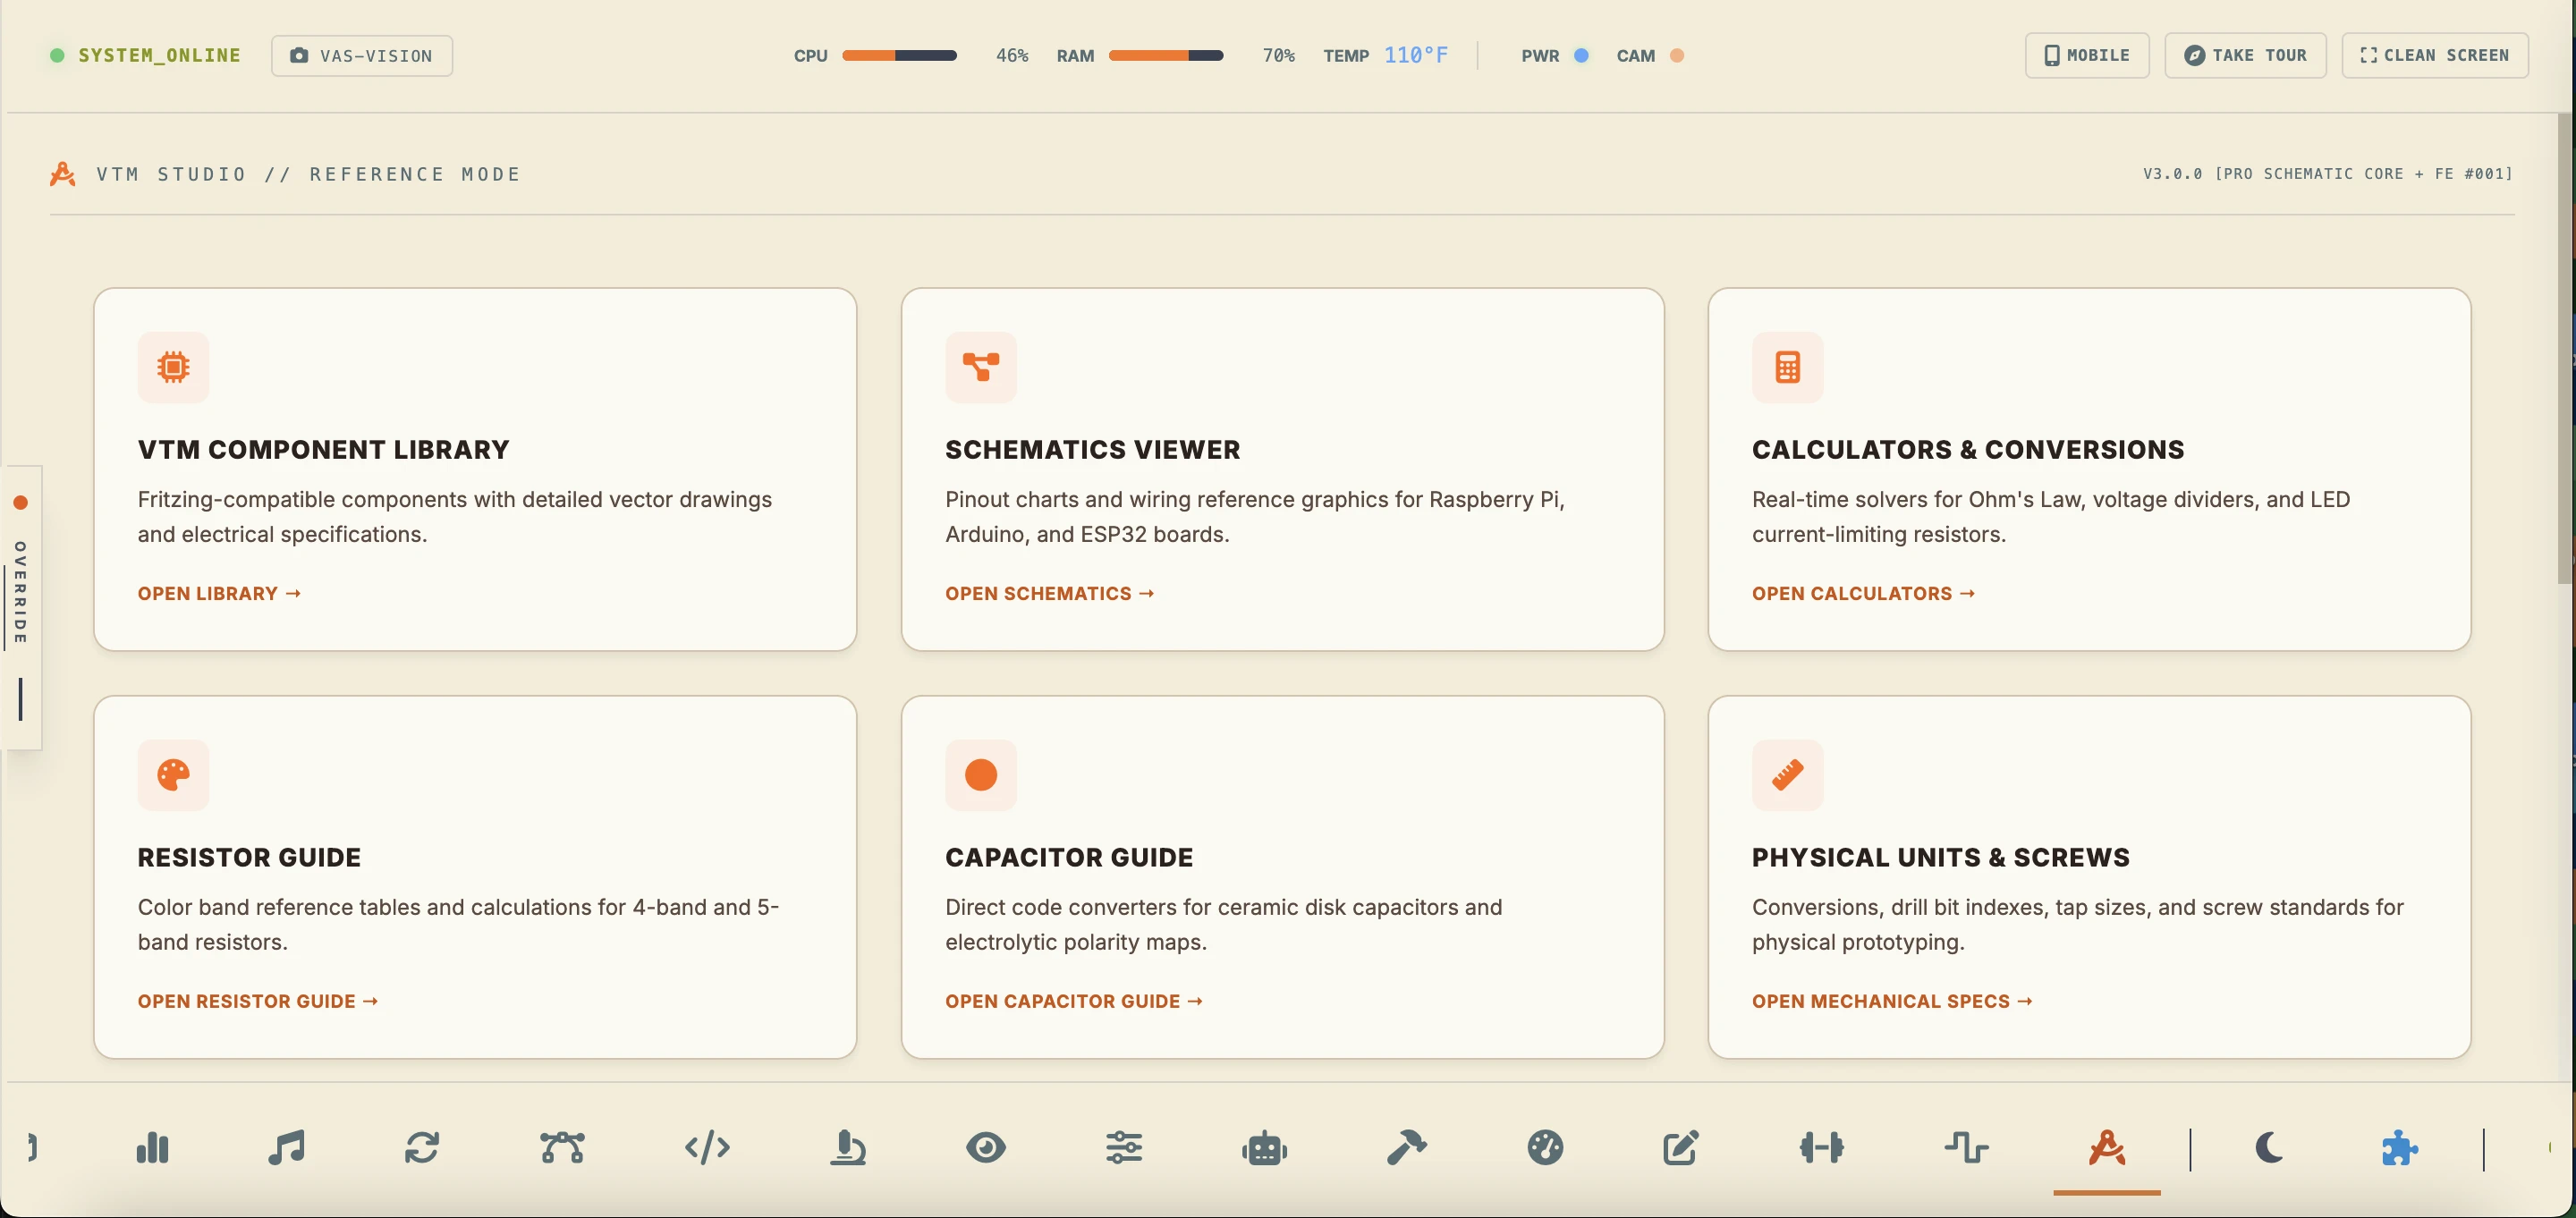
Interactive browser for physical maker boards, sensors, and controllers. Load full description sheets, operating voltages, and toggle views between Breadboard, Schematic, and PCB drawings.
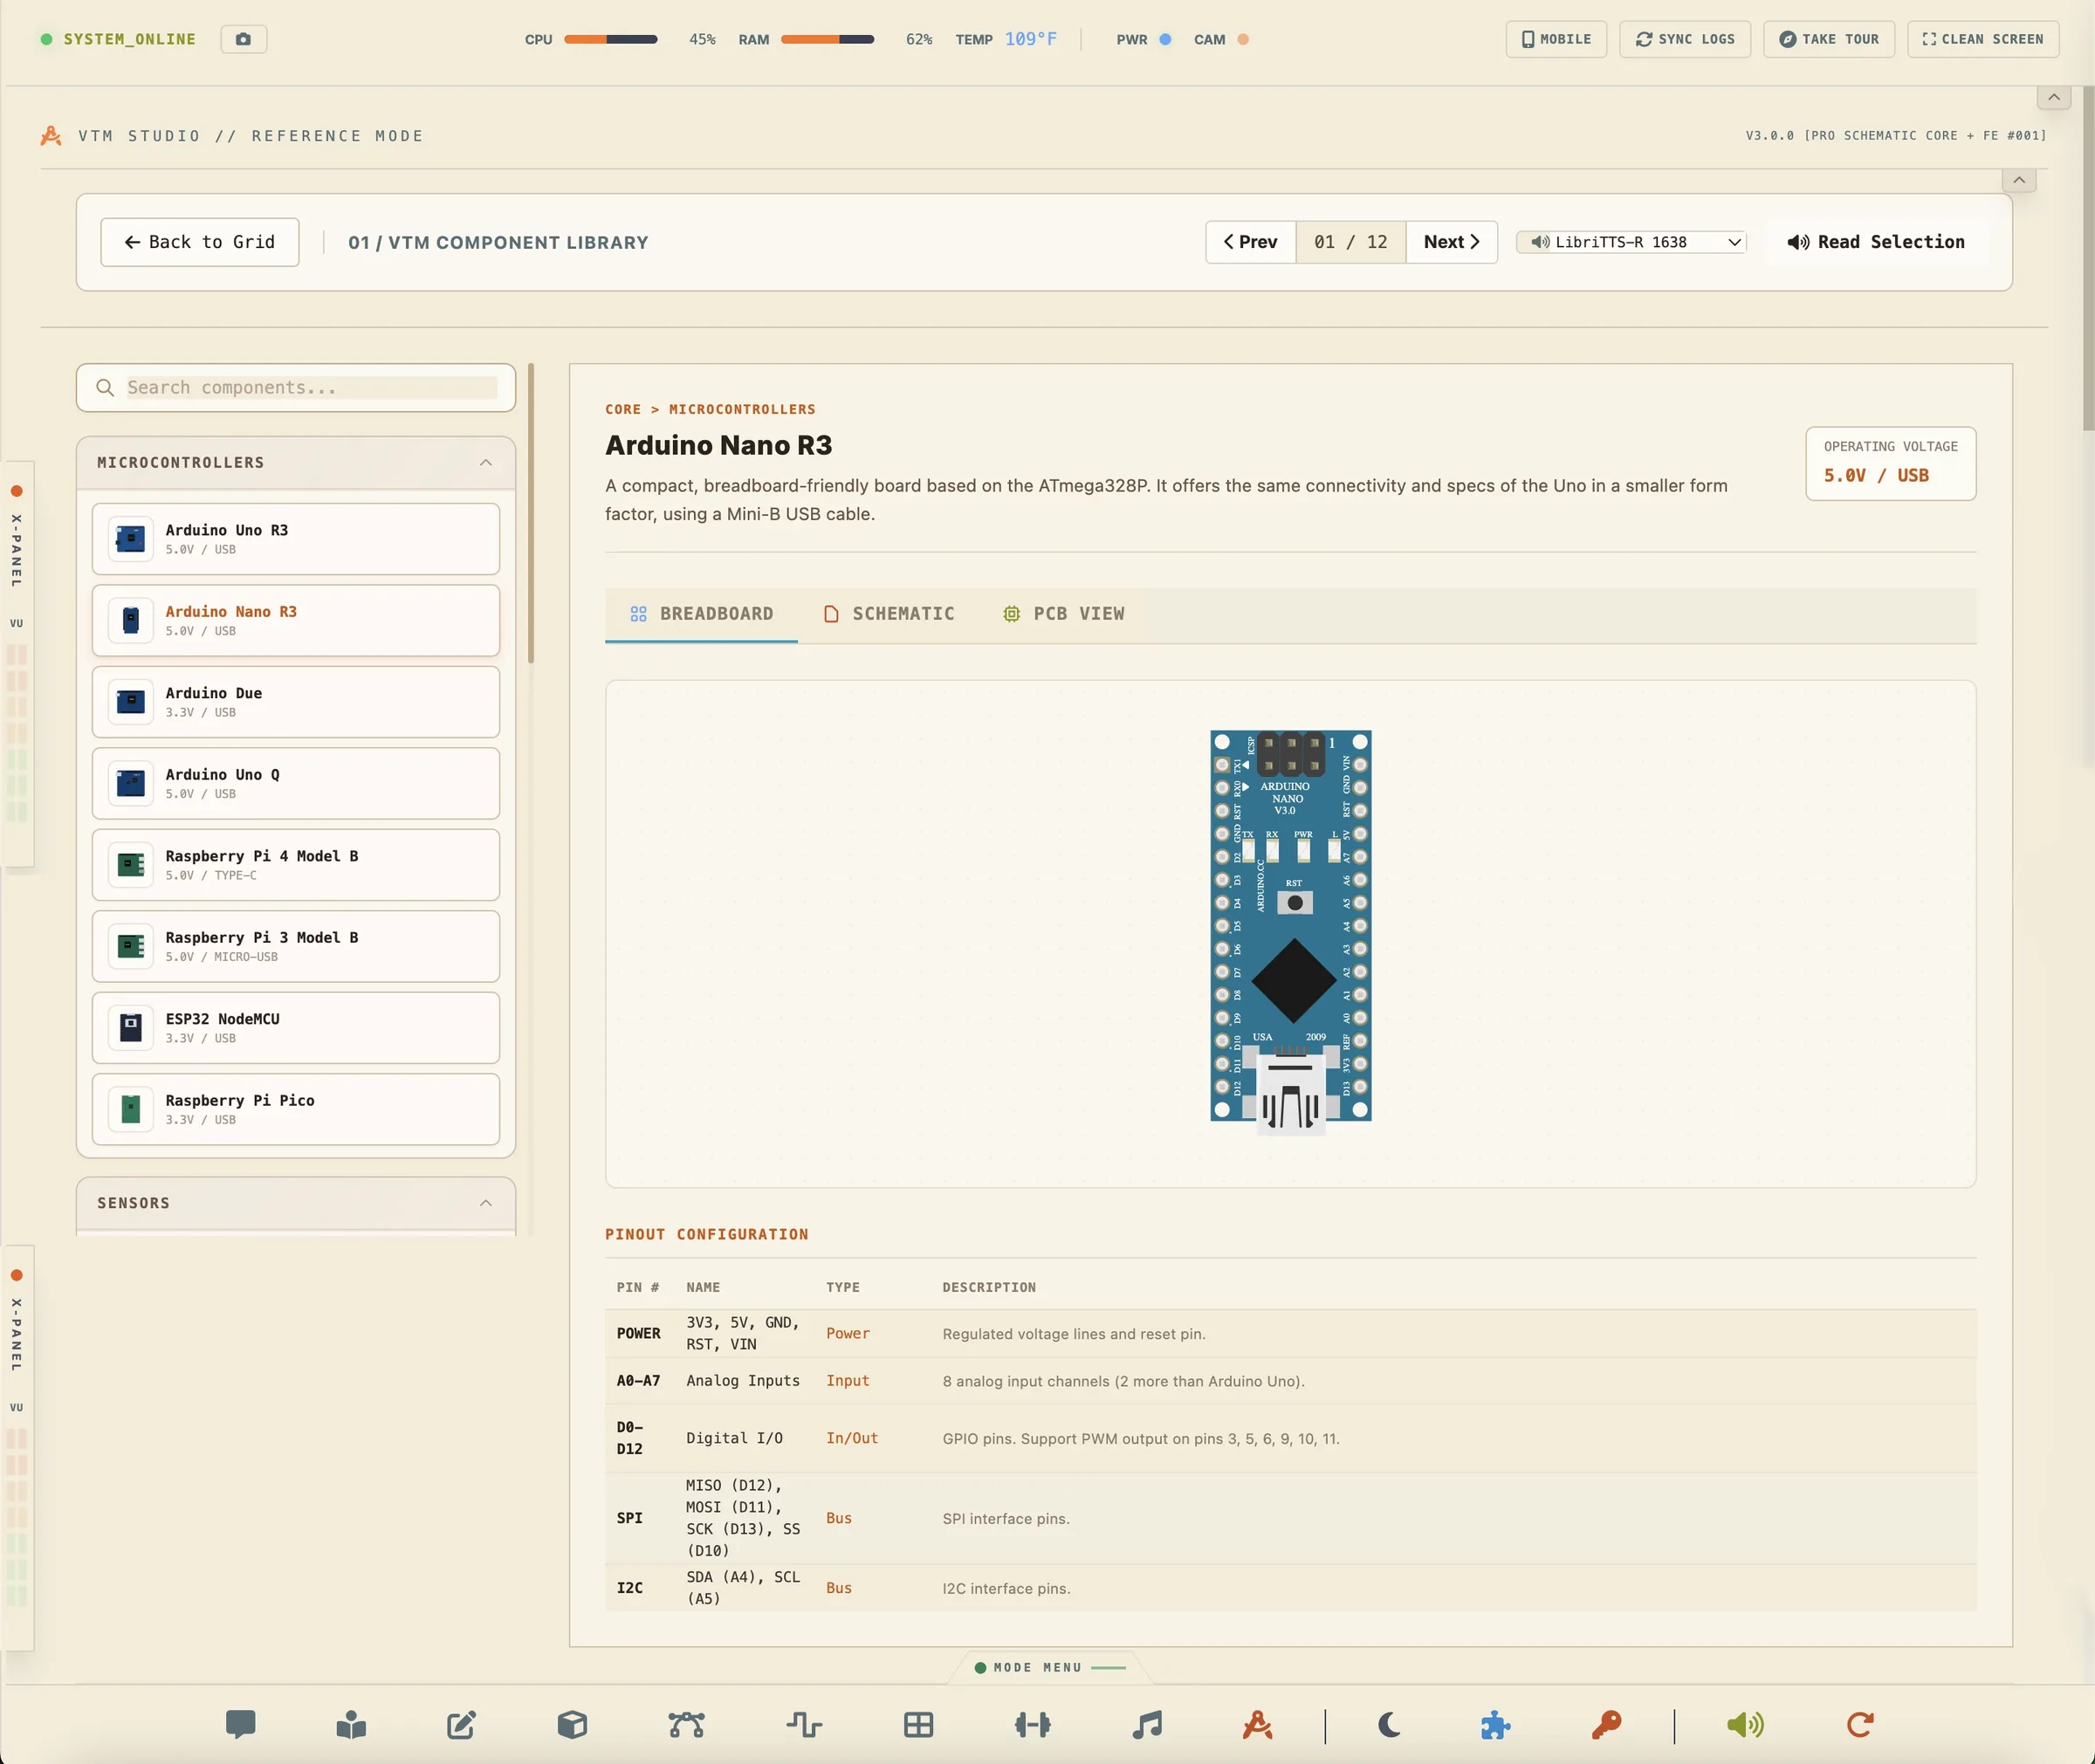
Comprehensive guide explaining schematic symbols for passives (resistors, capacitors, inductors), active components (diodes, LEDs, transistors), logic gates, op-amps, and ground nodes.
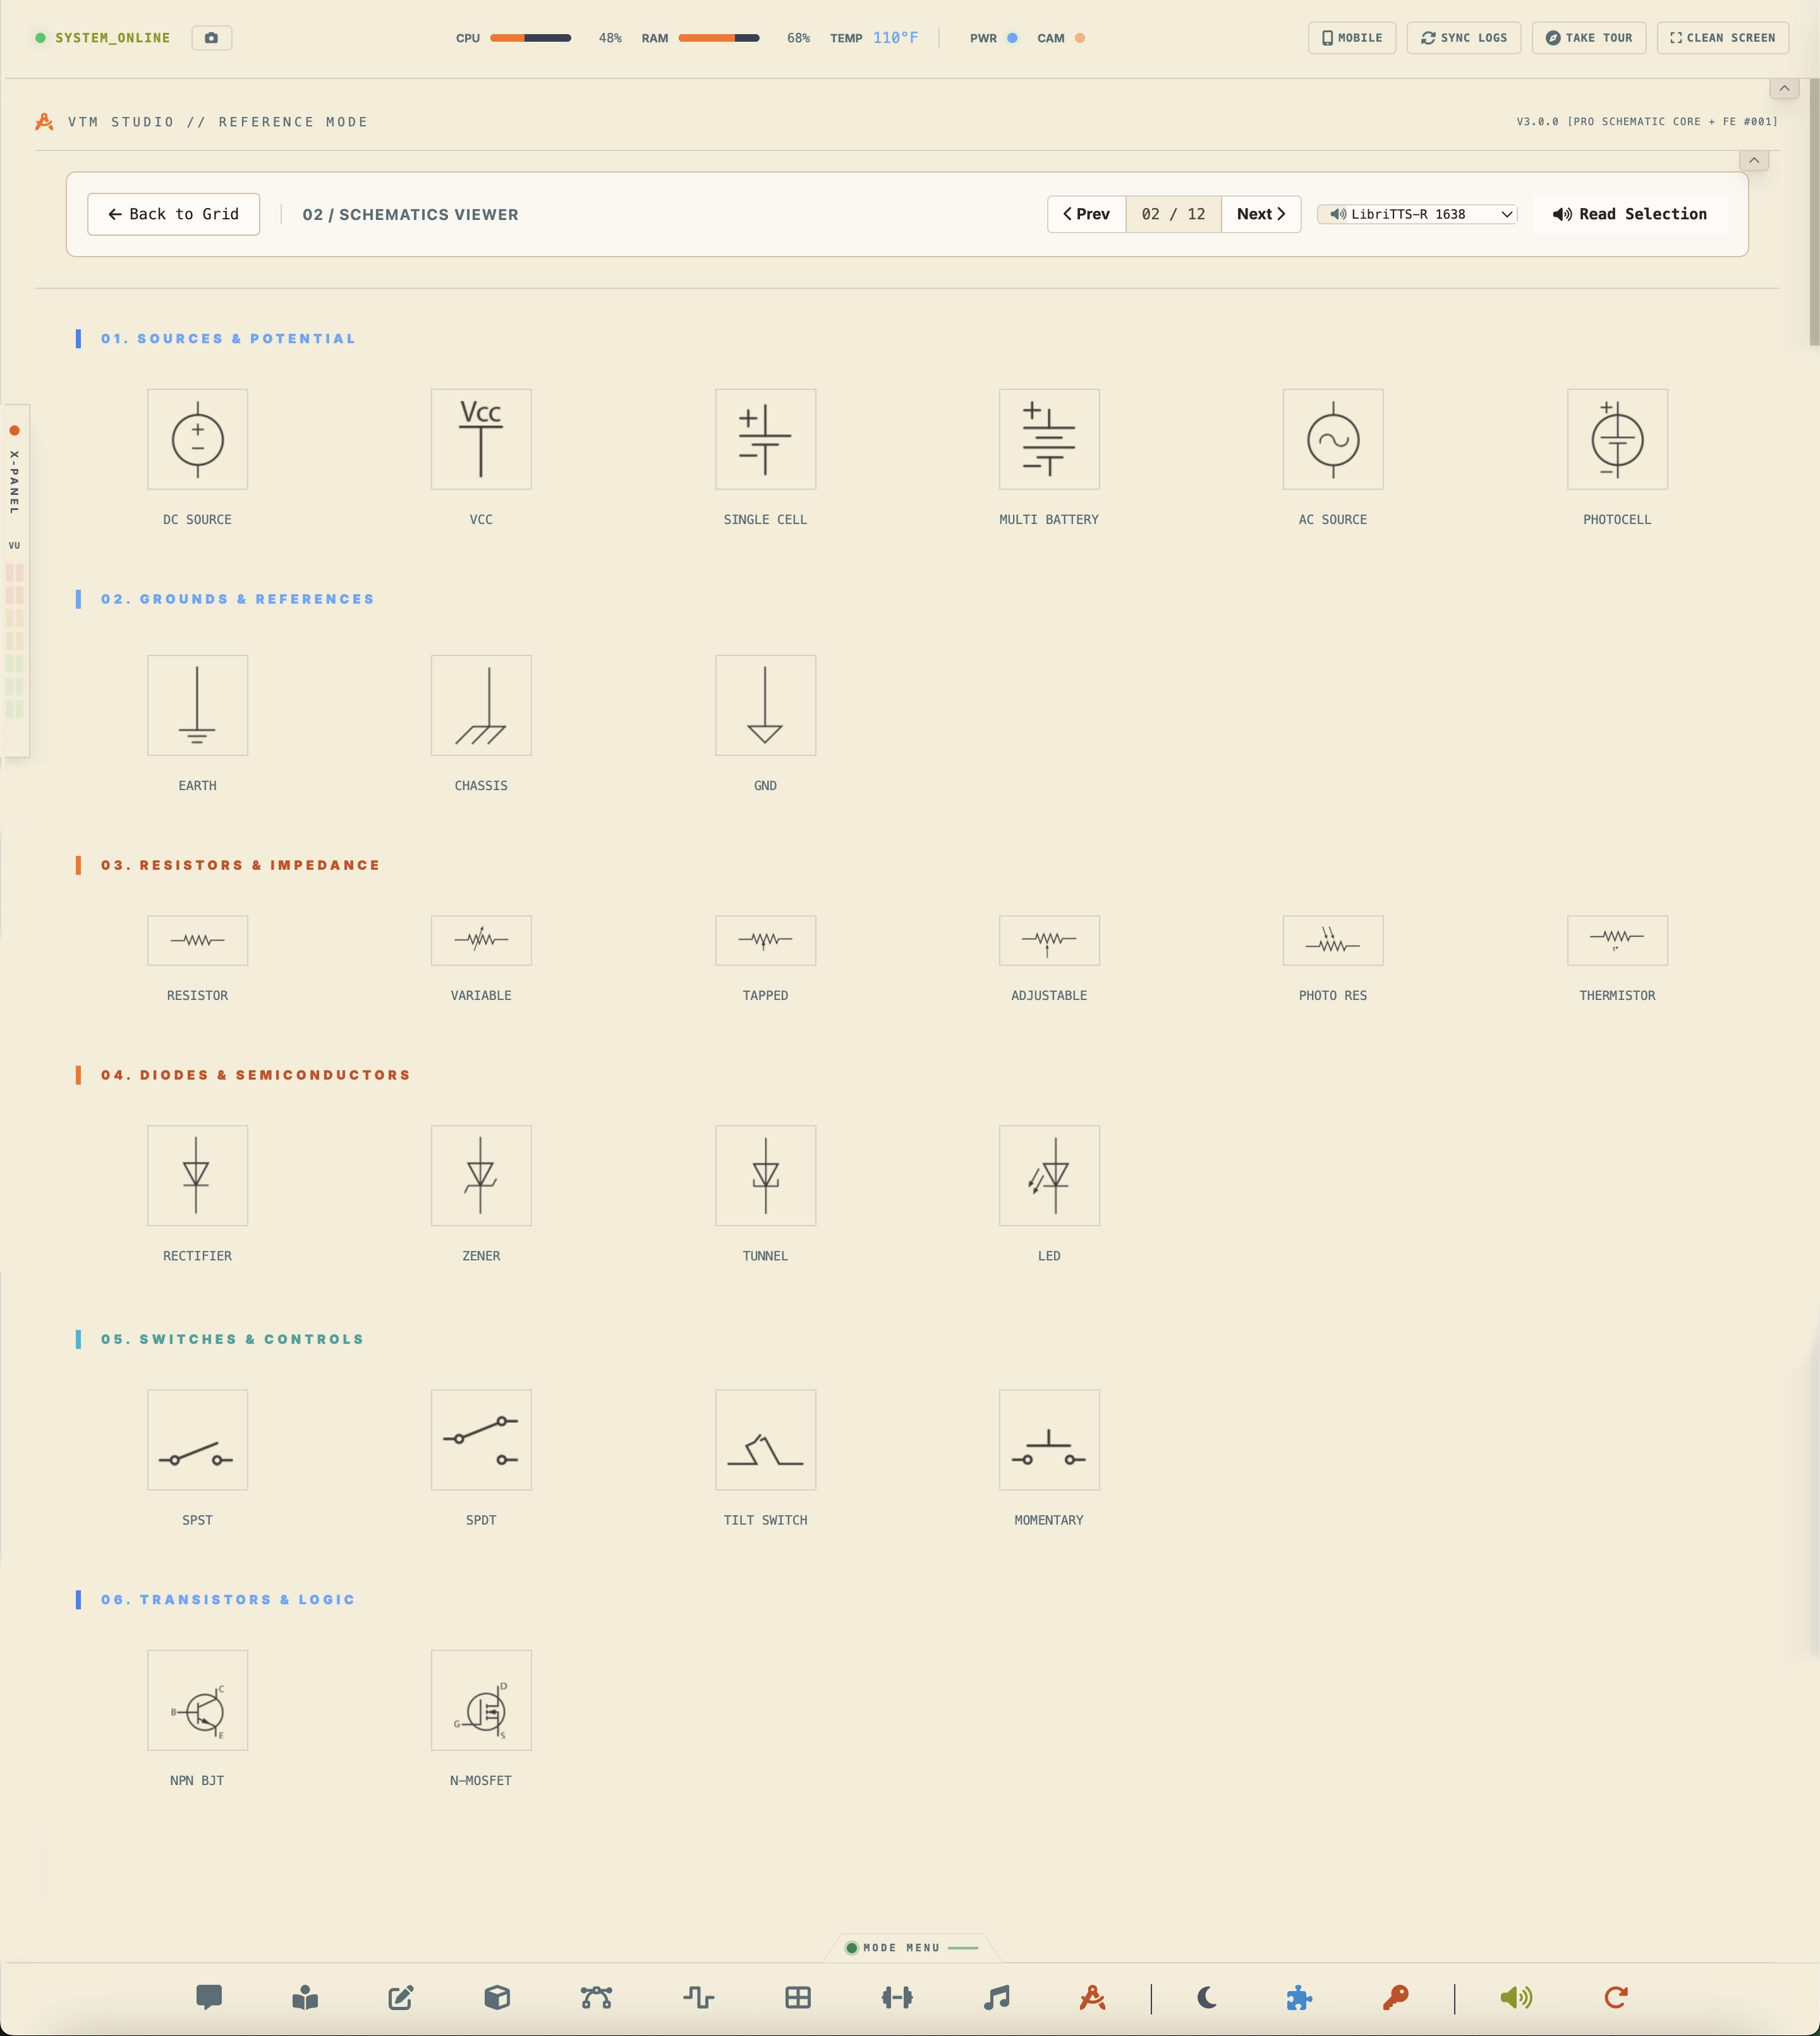
Dual-solver tool: 1) Ohm's Law Solver to compute voltage ($V$), current ($I$), resistance ($R$), or power ($P$), and 2) LED series resistor calculator to find the target current-limiting resistance.
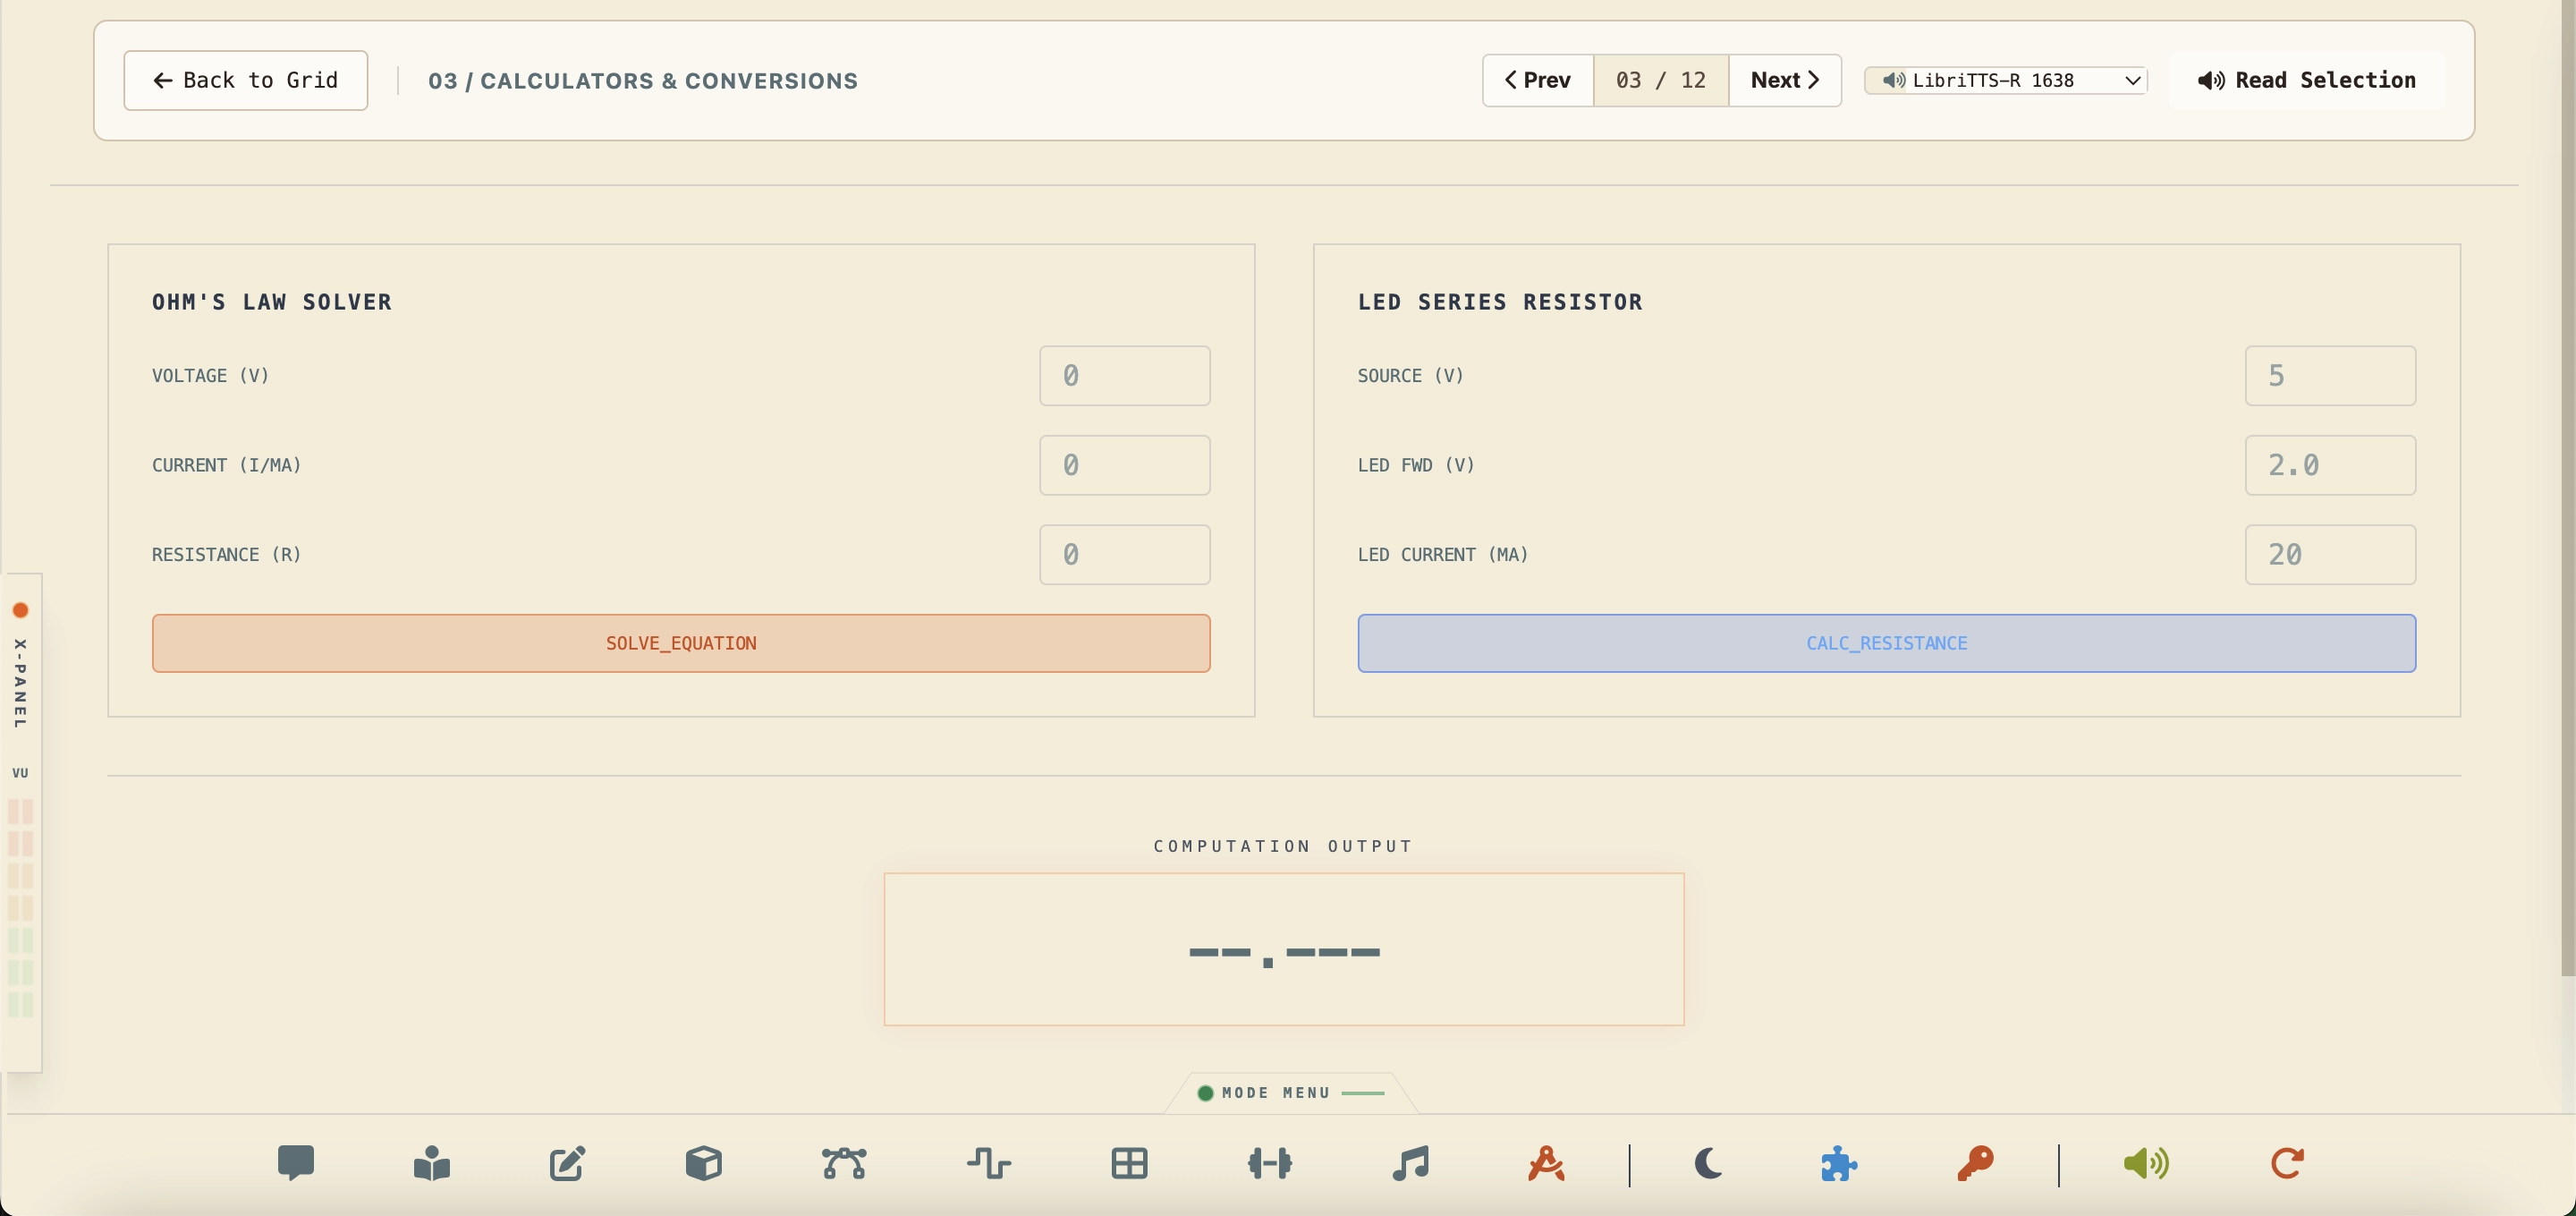
Resistor color band decoder. Explains the mathematical formula of 4-band and 5-band resistors, lists color codes, and maps wattages (1/8W to 10W) with safety derating guidelines.
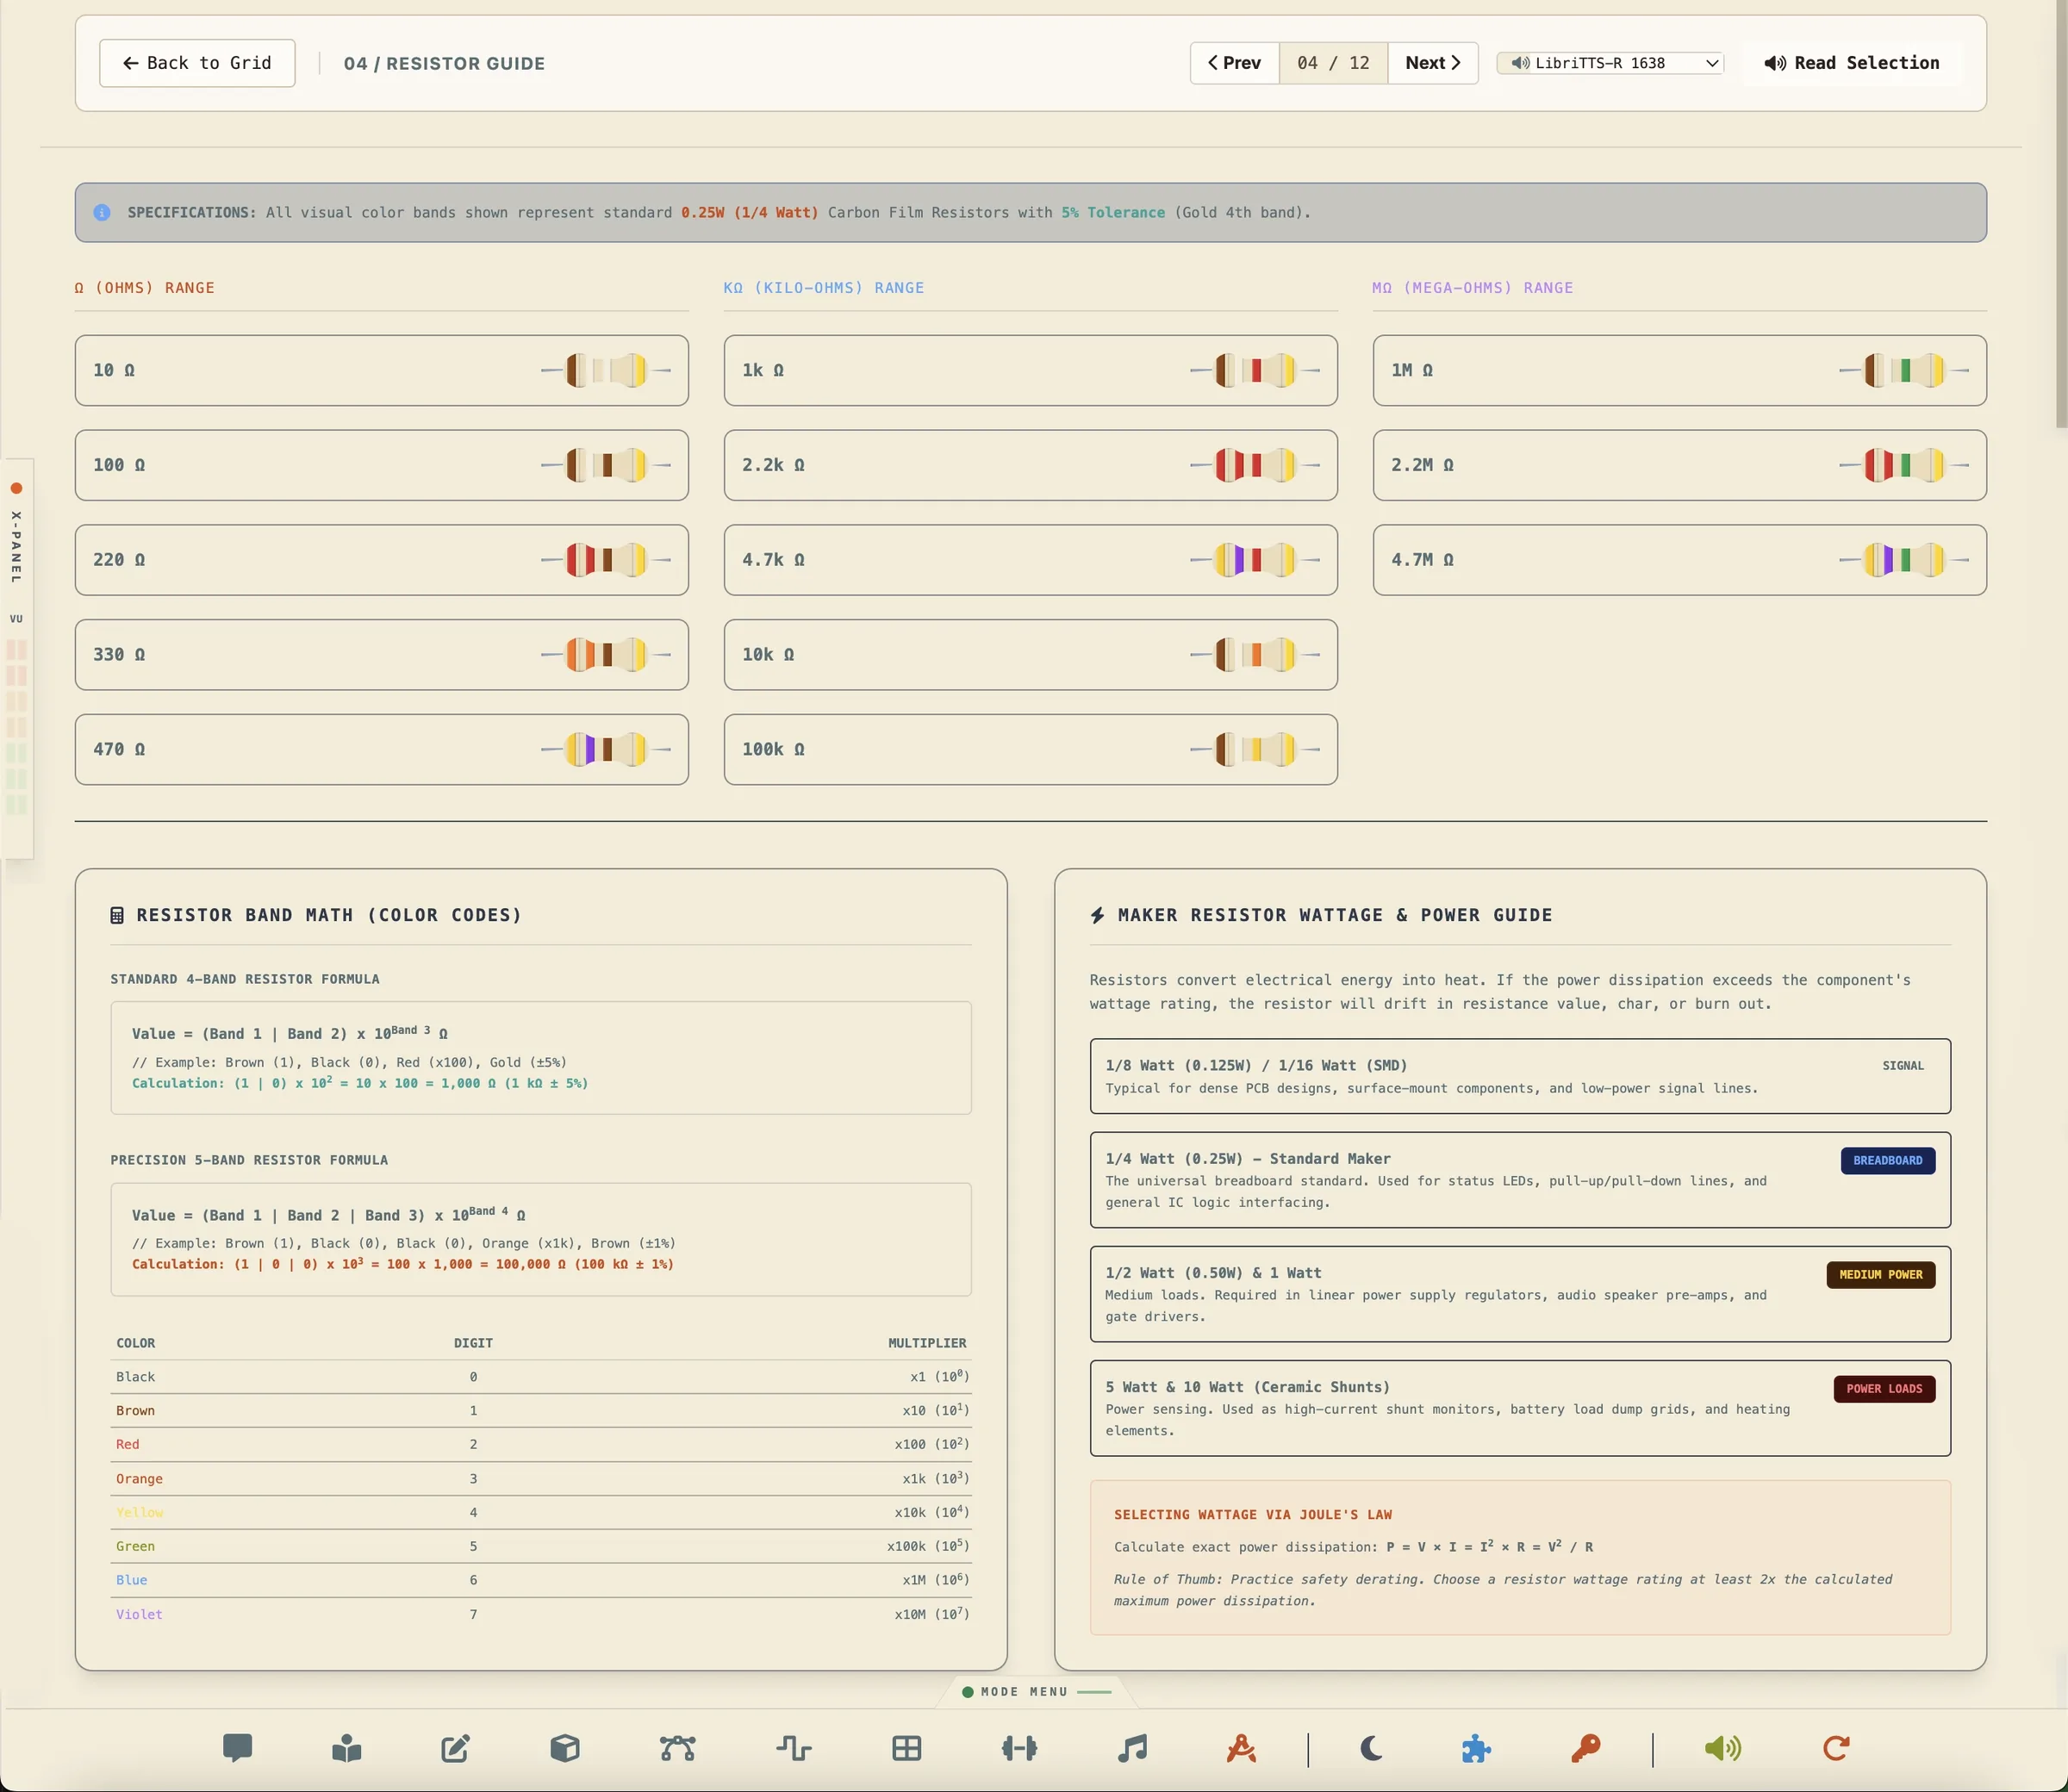
Capacitor code translation chart mapping 3-digit ceramic disk identifiers (101 to 106) to microfarad (µF), nanofarad (nF), and picofarad (pF) capacity values.
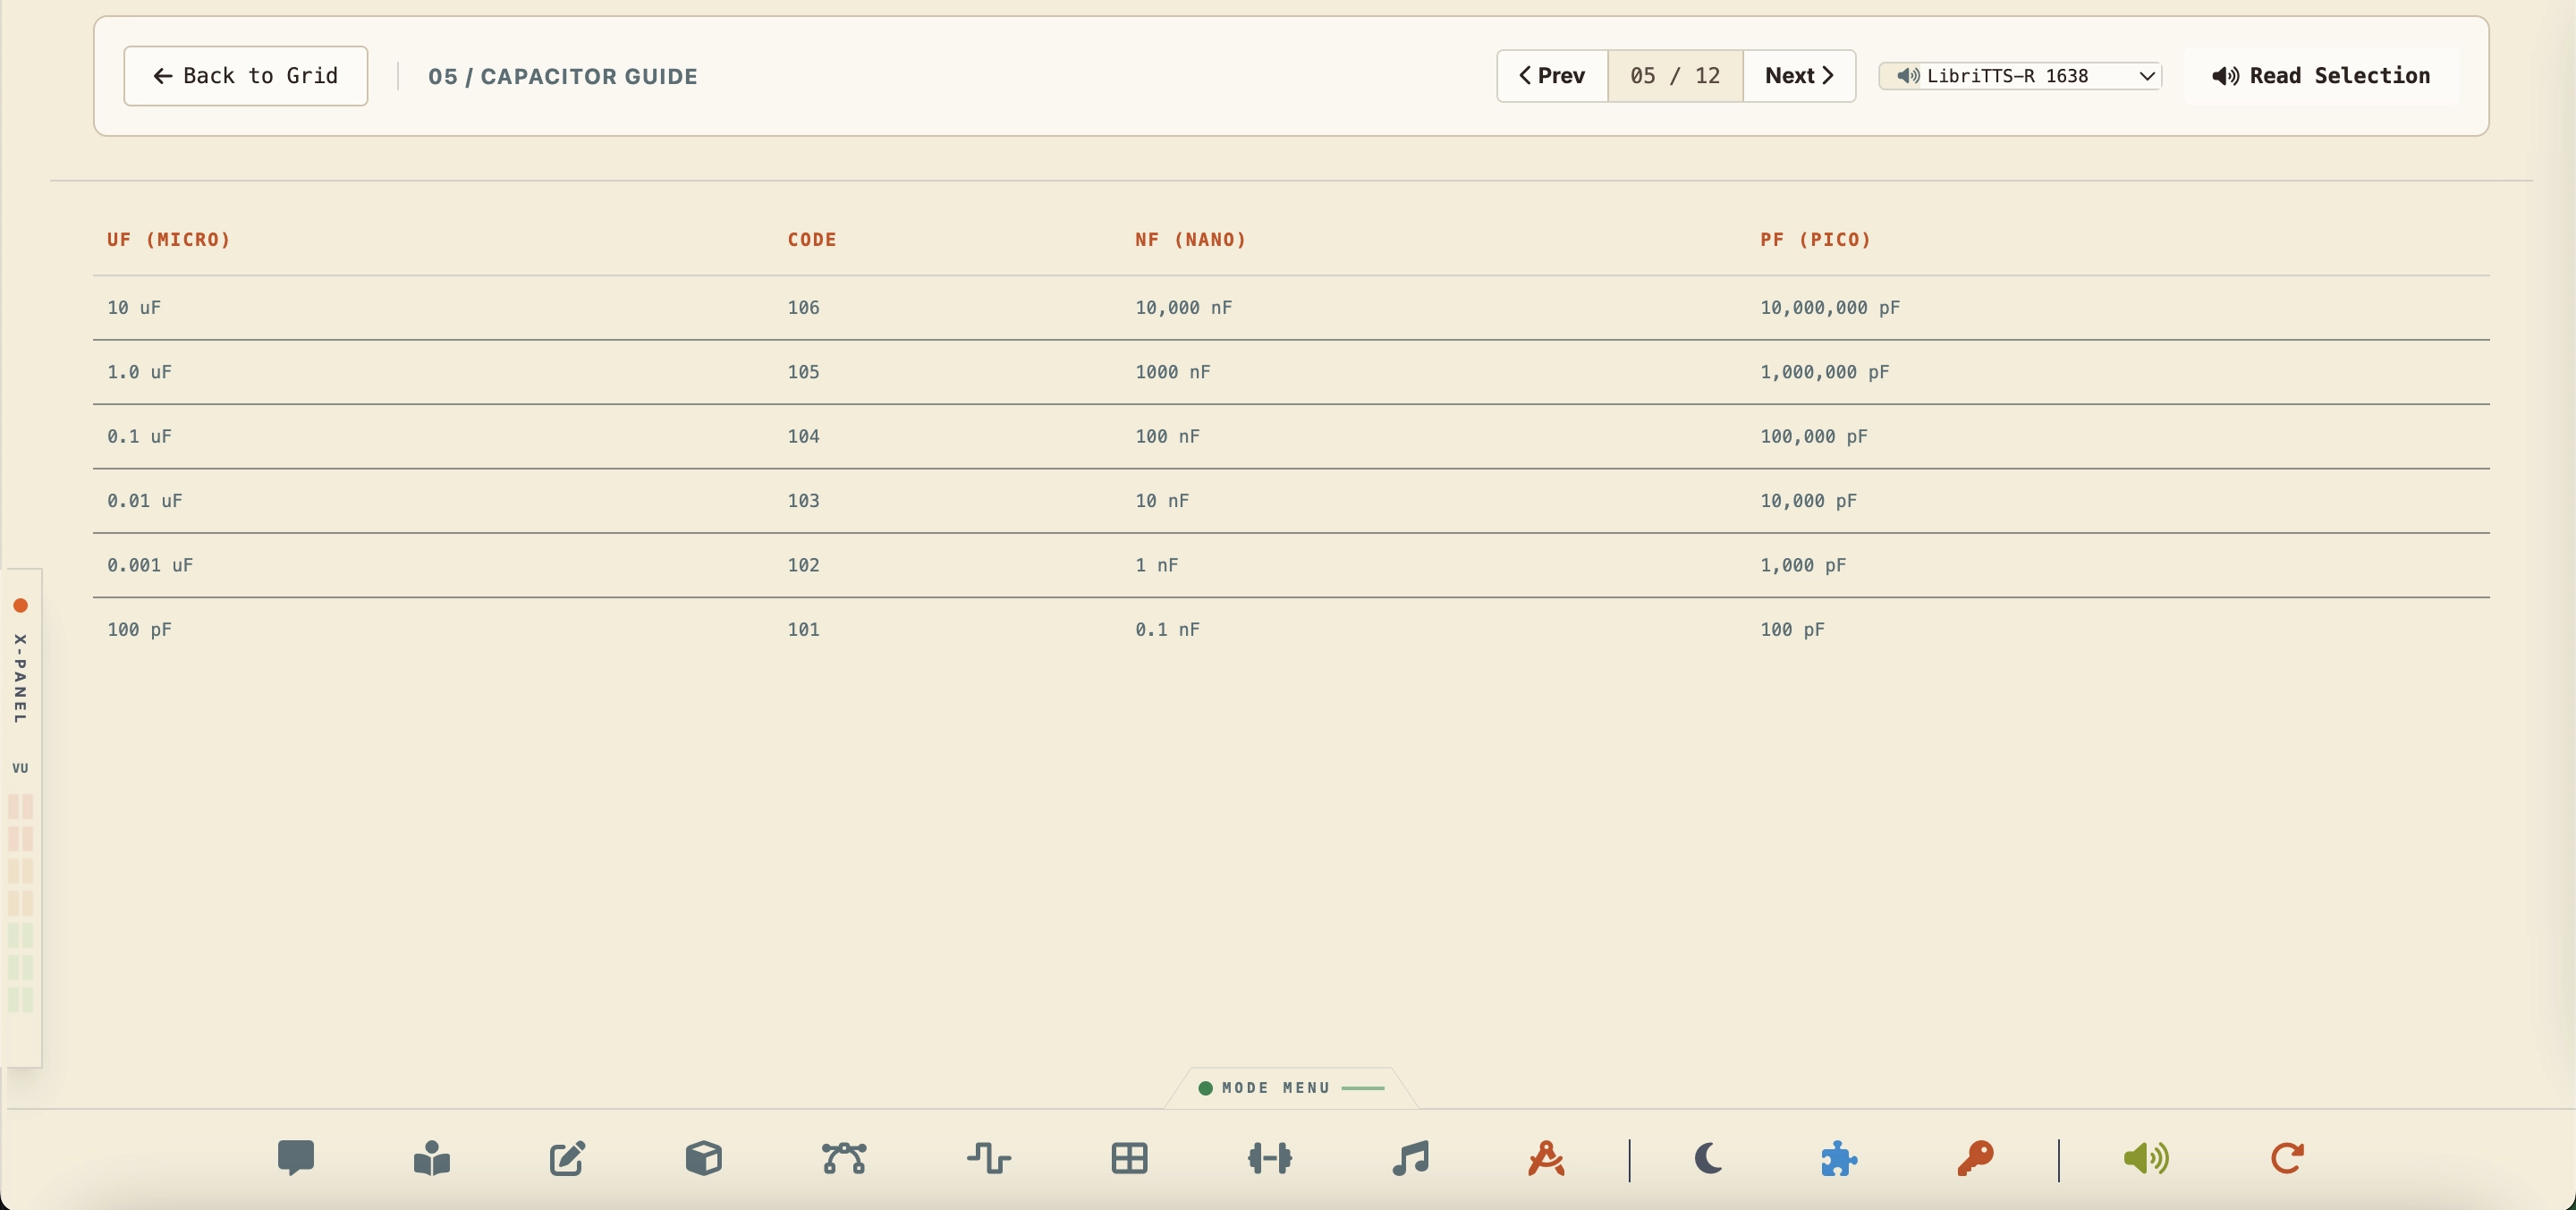
Mechanical index lists covering thread diameters, pitches, and tap/clearance drill sizes for Metric (M2-M6) and Imperial (#4-40 to 1/4"-20) fasteners, plus PCB pin header pitches.
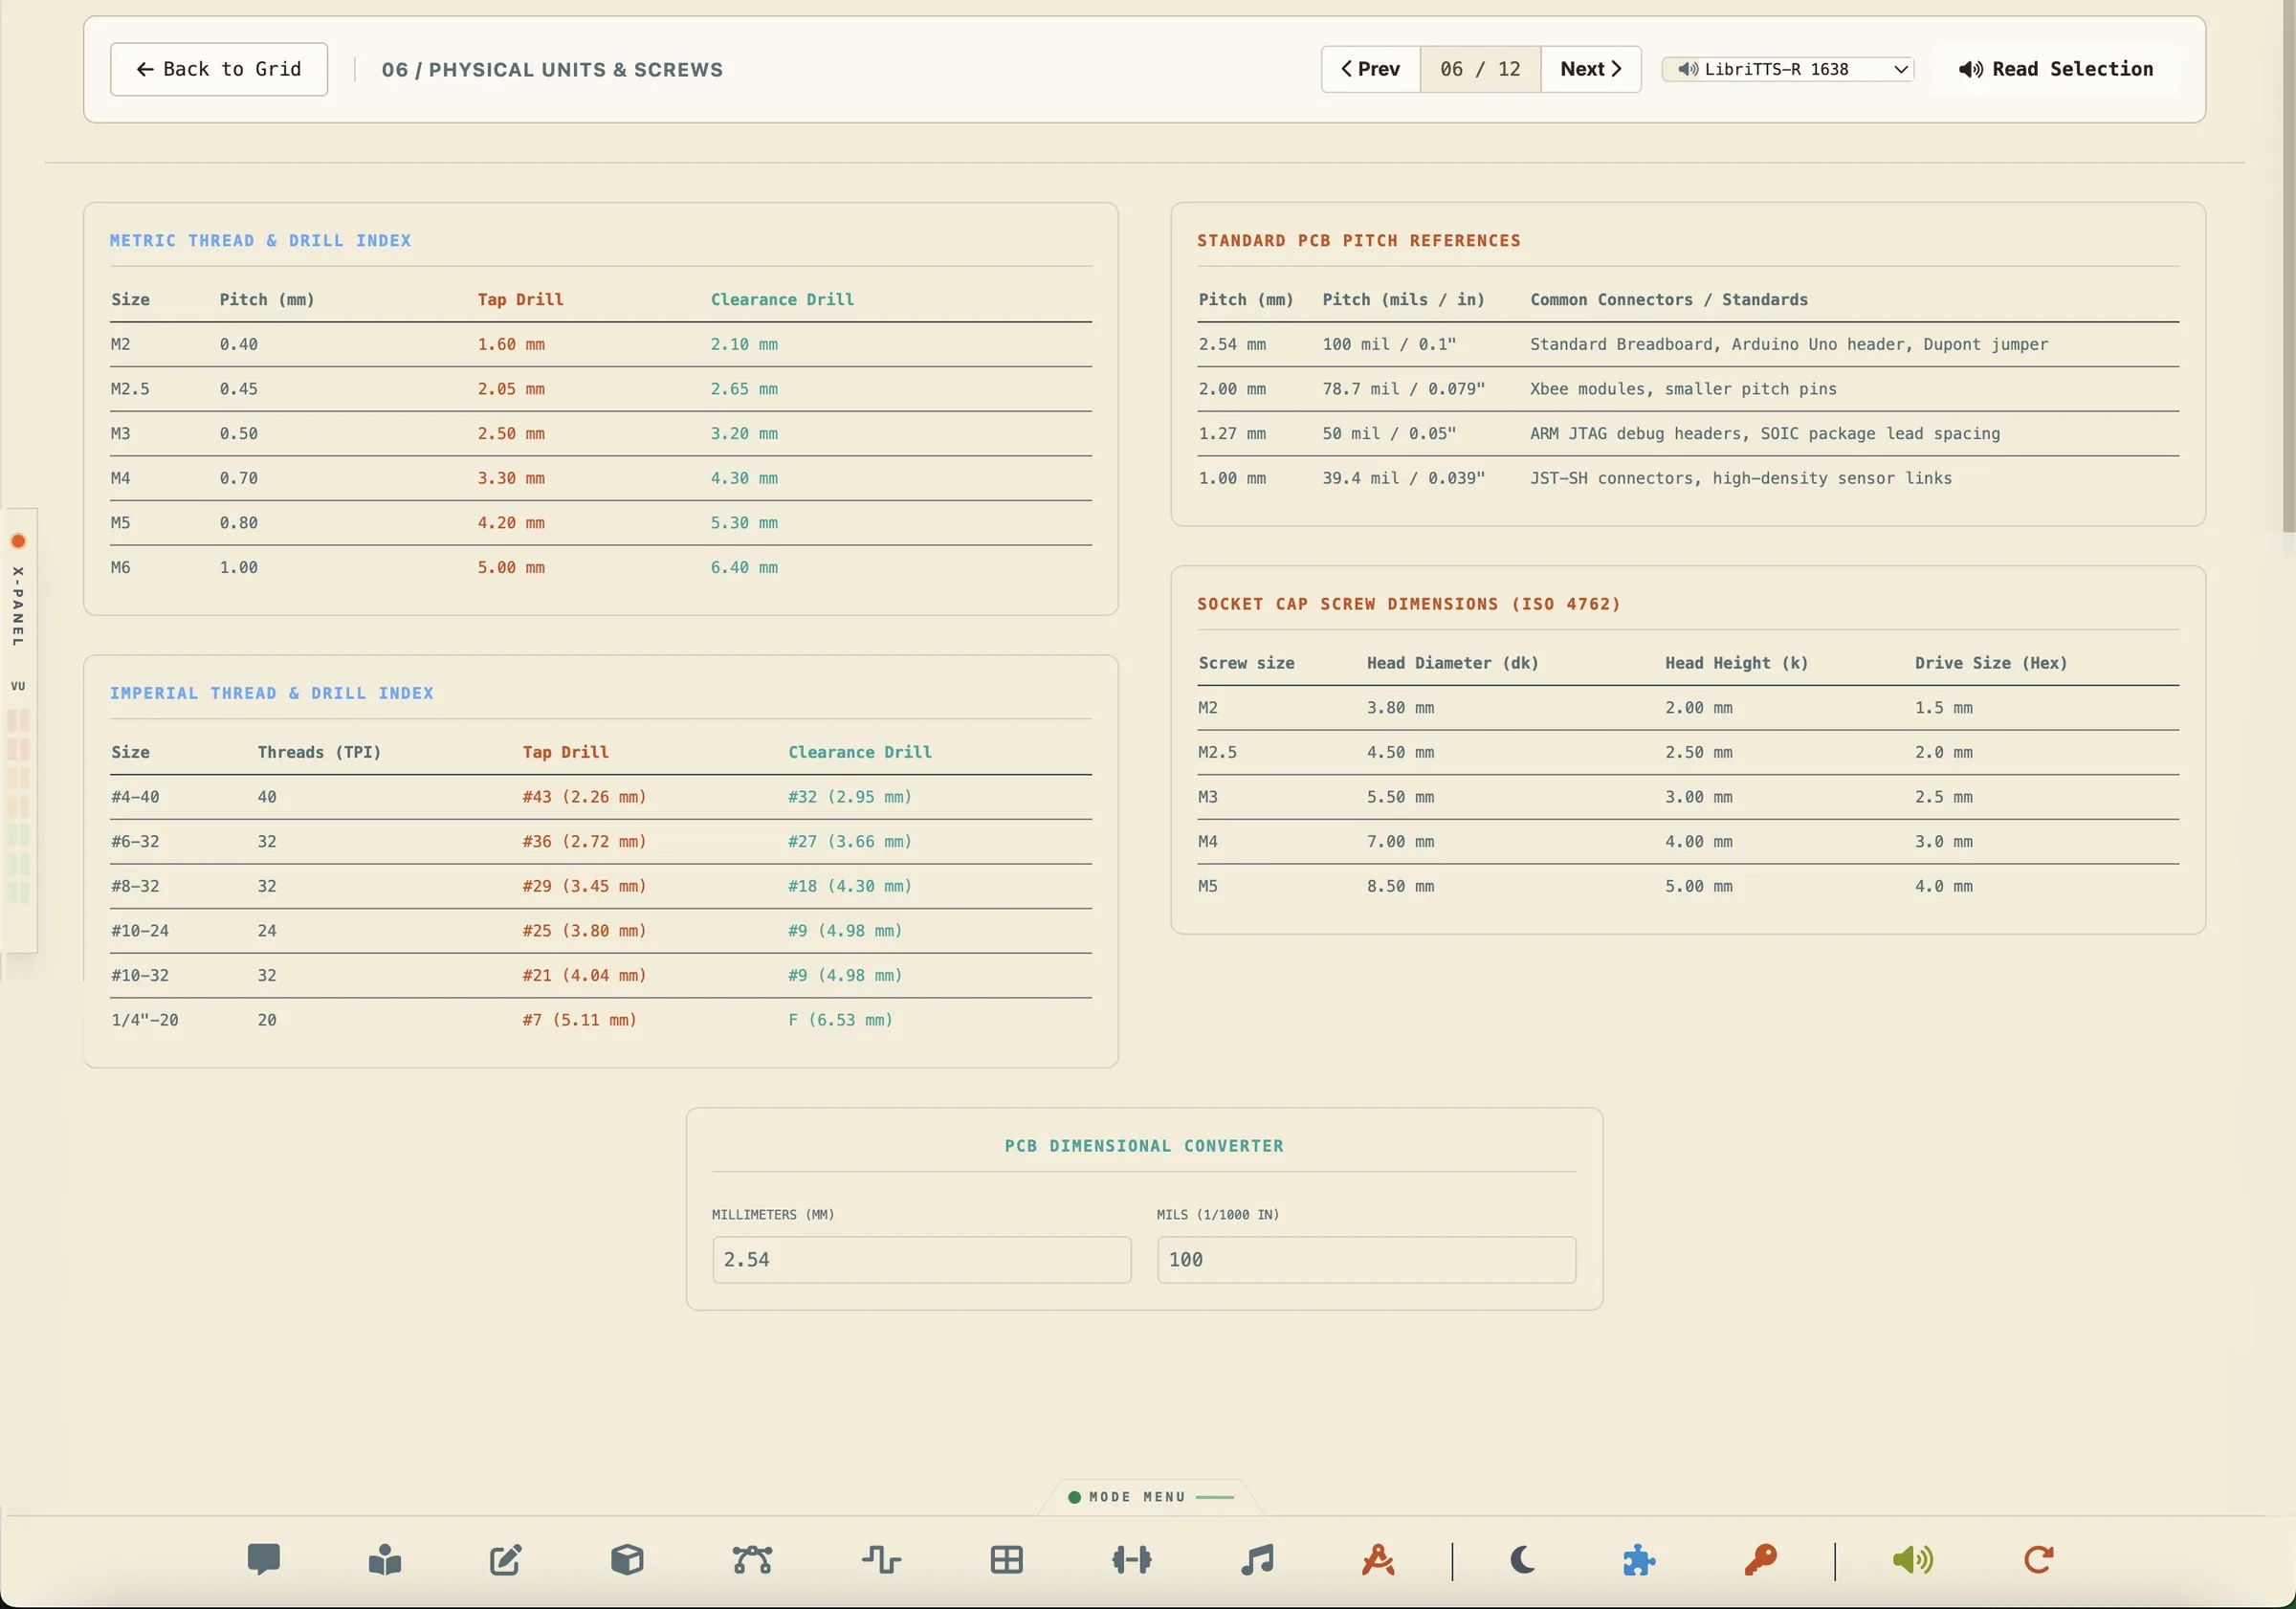
SVG CAD wireframe dimensional drawings for popular prototyping boards (Arduino Uno, Raspberry Pi Pico, ESP32, HC-SR04 sensor, and 0.96" OLED display).
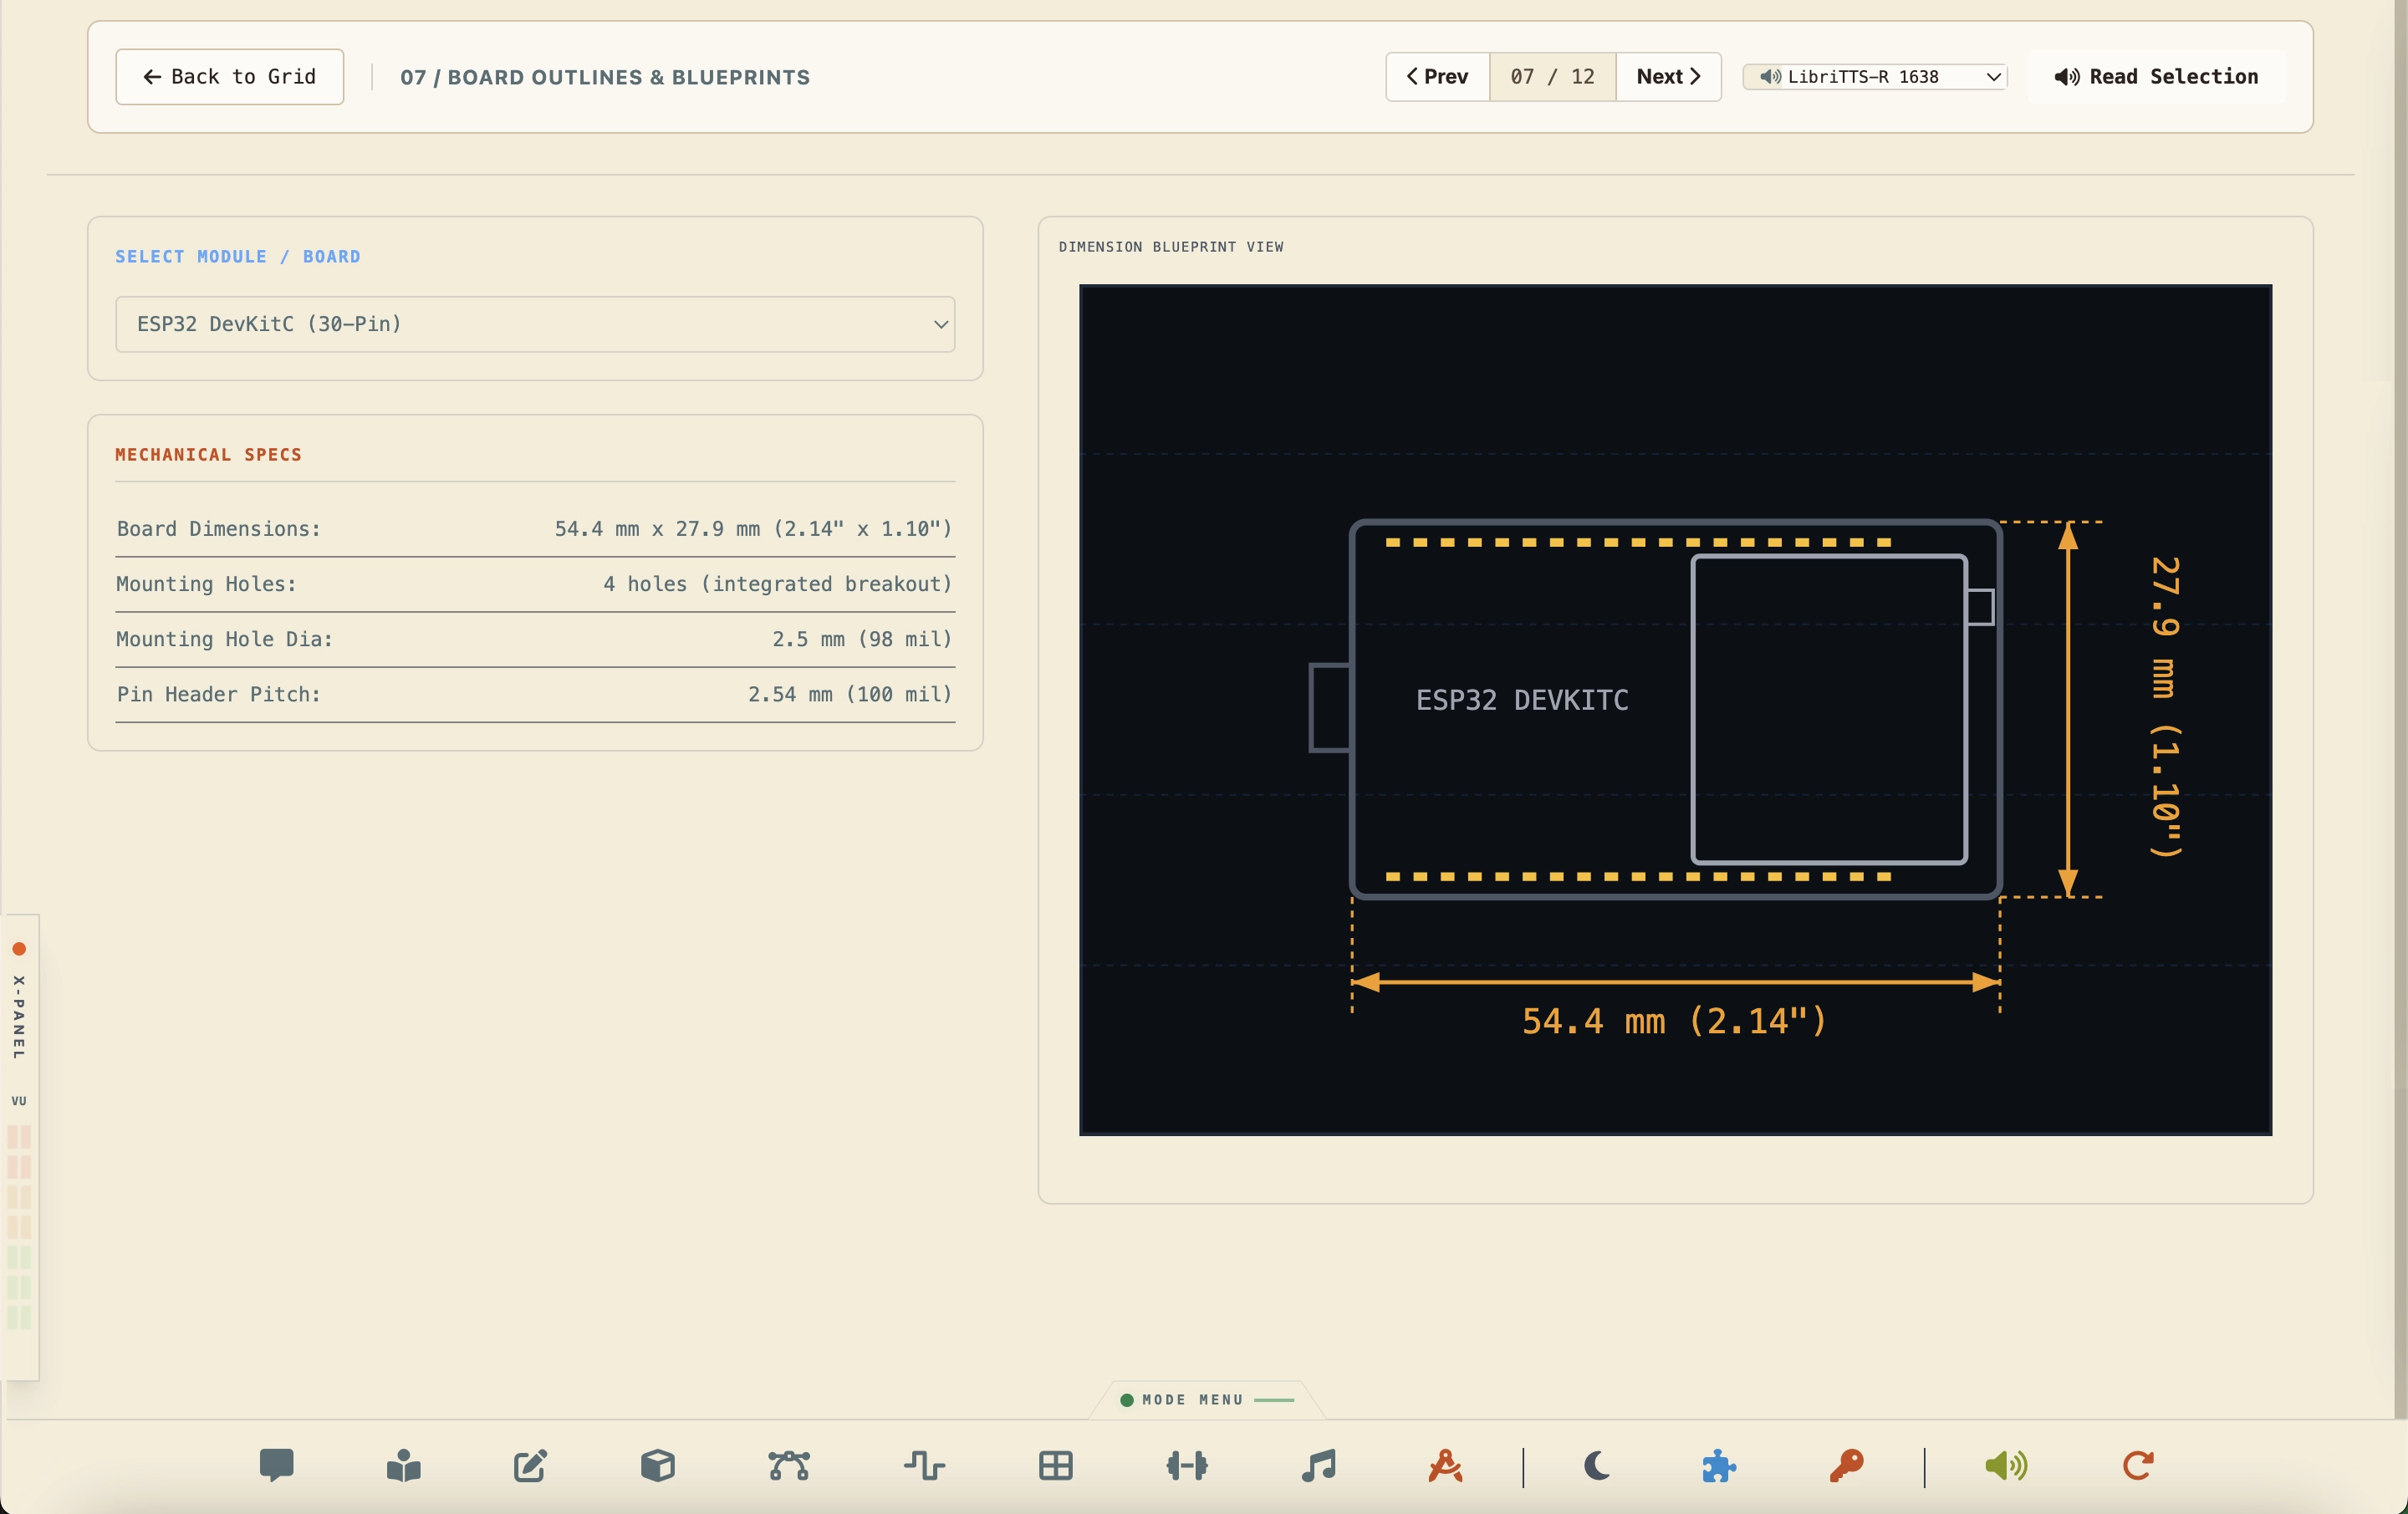
Calculates mass and physical displacement volumes for raw materials (Copper, Brass, PLA, Aluminum, Steel, Resin) across Spherical, Cylindrical, and Prism geometries.
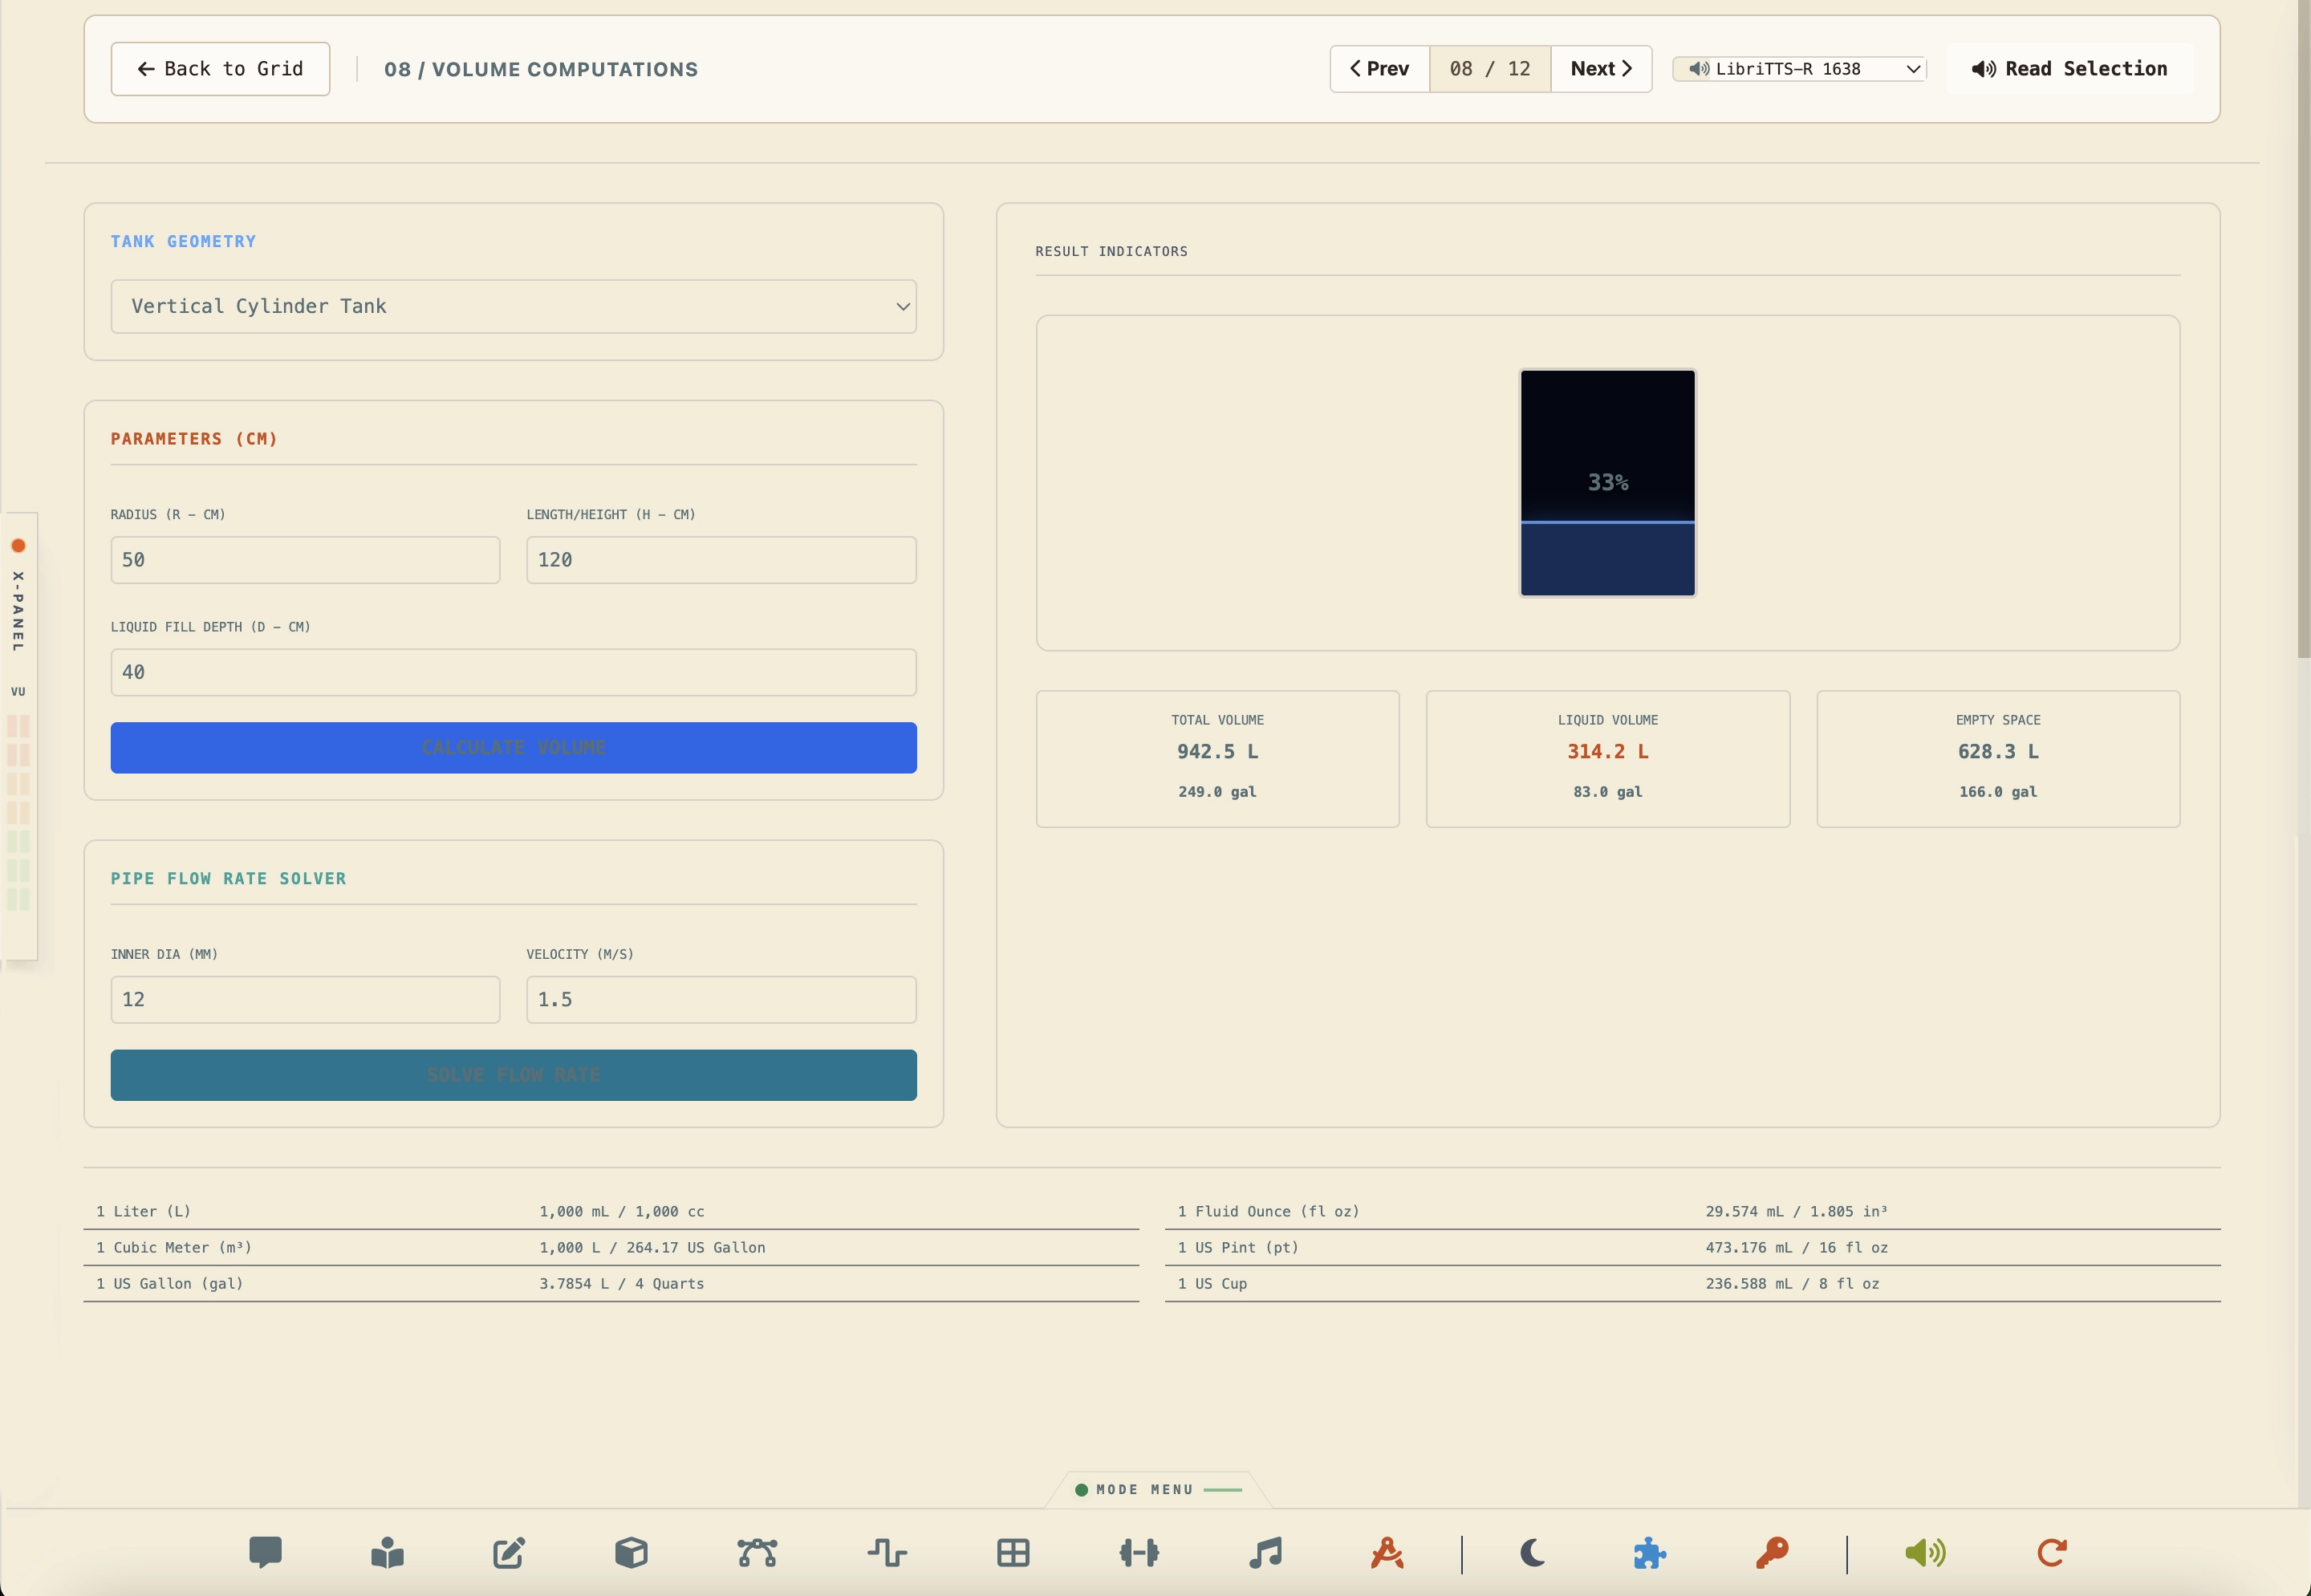
AWG physical characteristics charts matching wire thickness parameters (diameter, resistance per kilometer) with maximum chassis and power carrying currents.
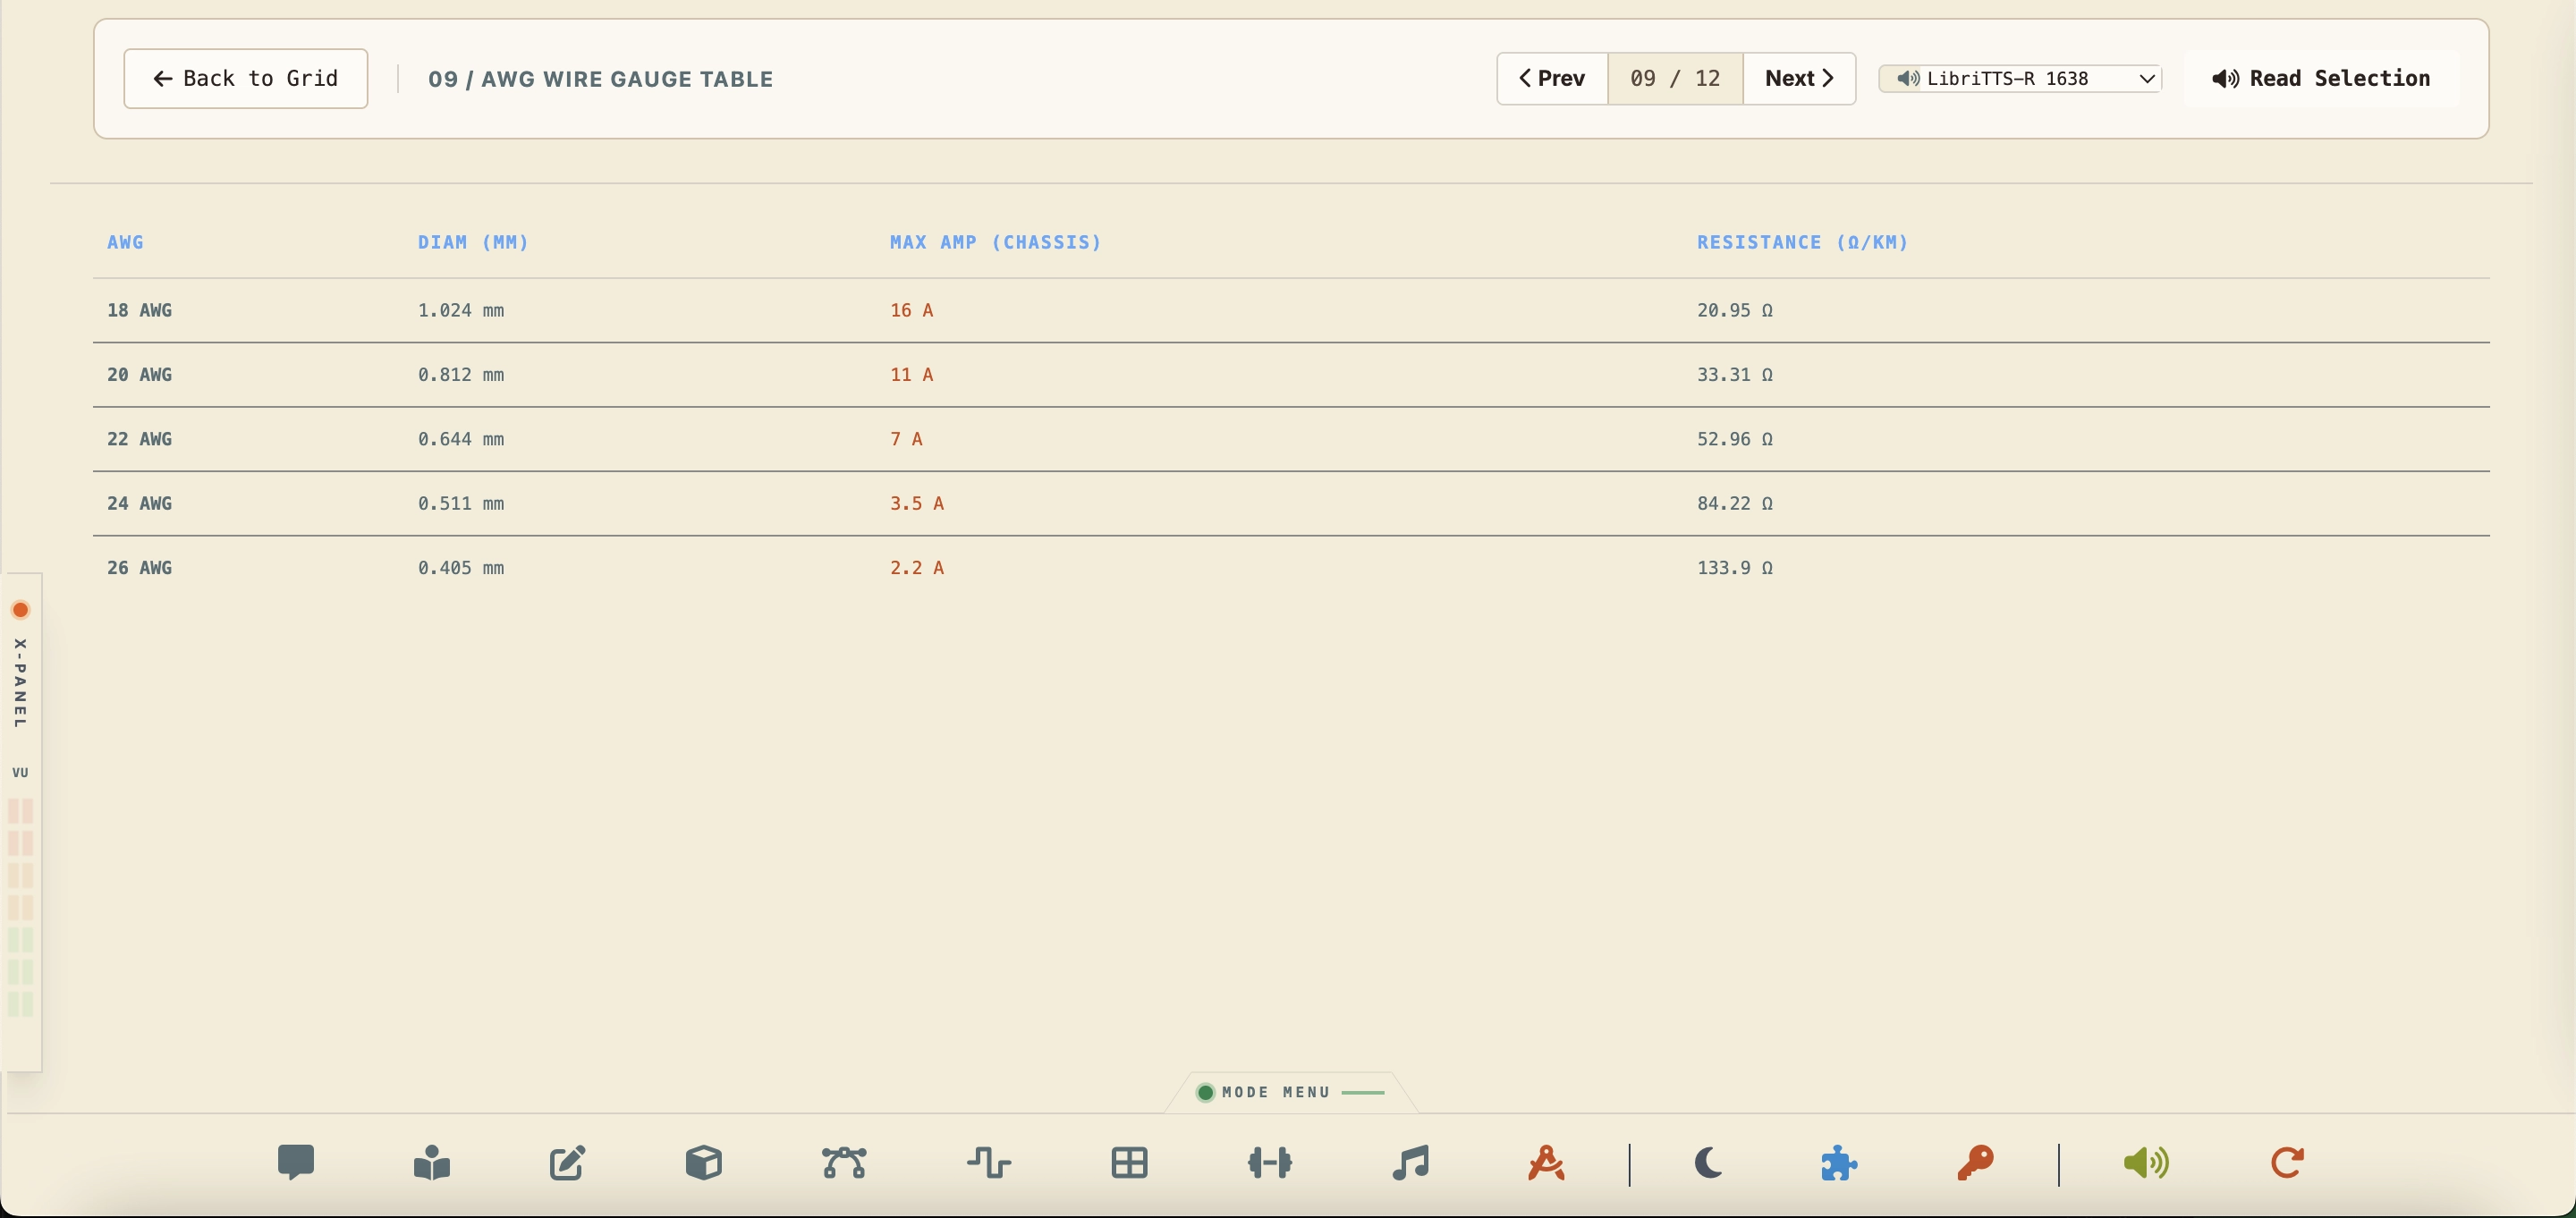
Filament print configuration matrices: details printing temperatures, heatbed guidelines, and print volumes for standard plastics (PLA, PETG, ABS, TPU, Nylon) and SLA resins.
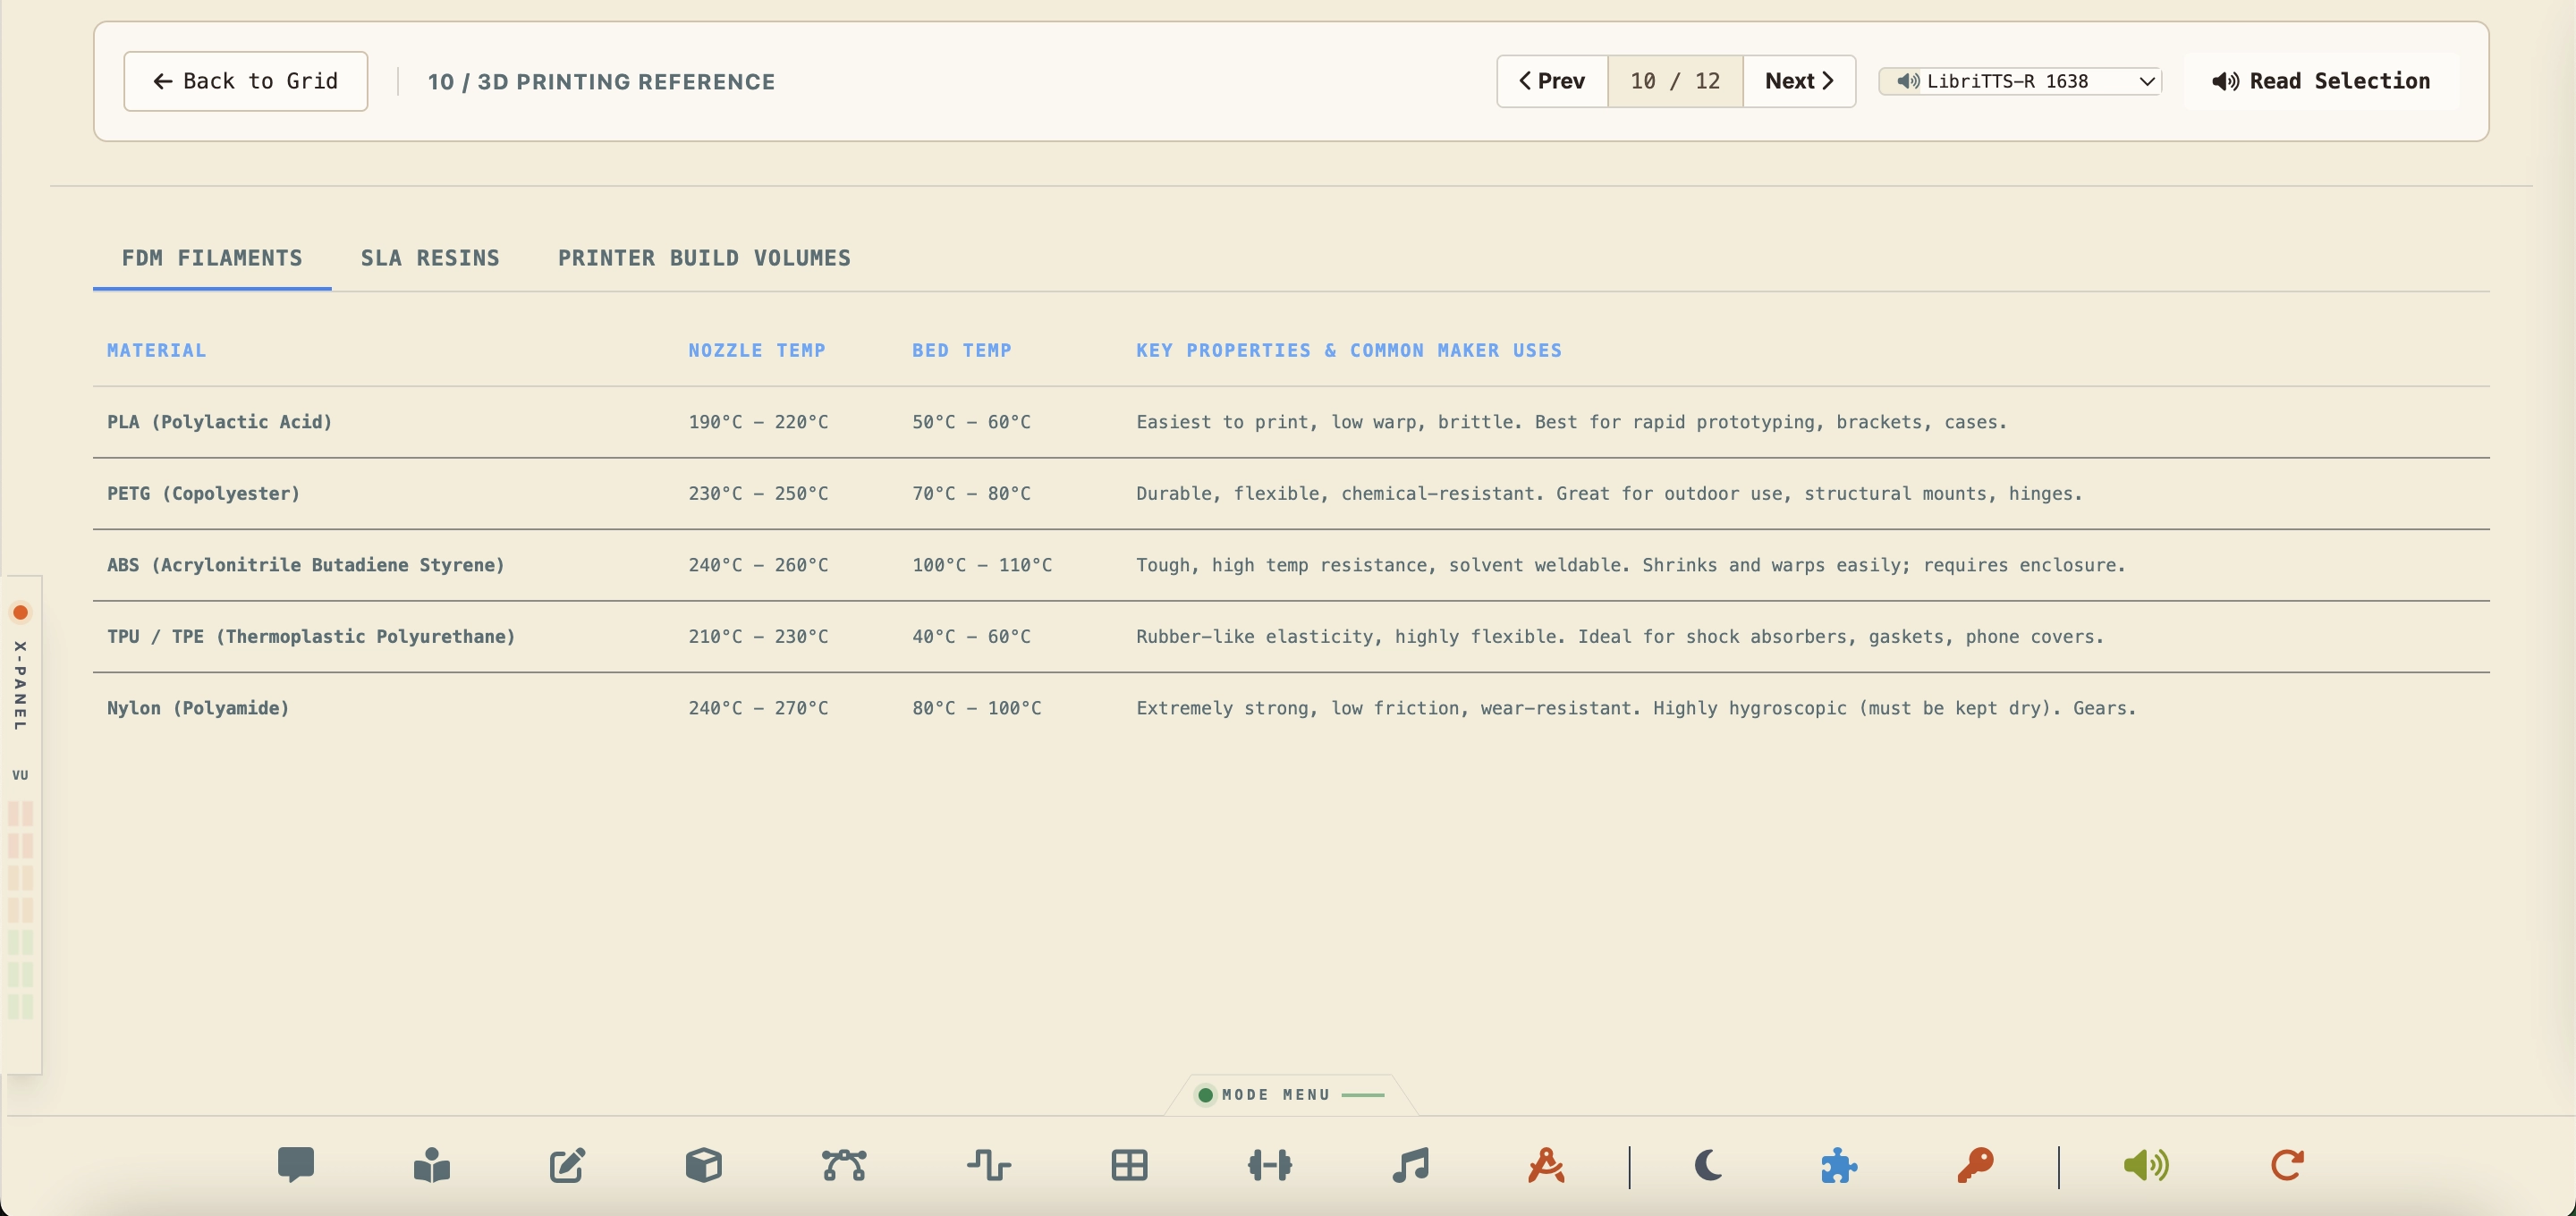
Overview block diagrams and technical specifications comparing computing hardware: MCU, MPU, GPU, NPU, TPU, FPGA, DSP, and SoC.
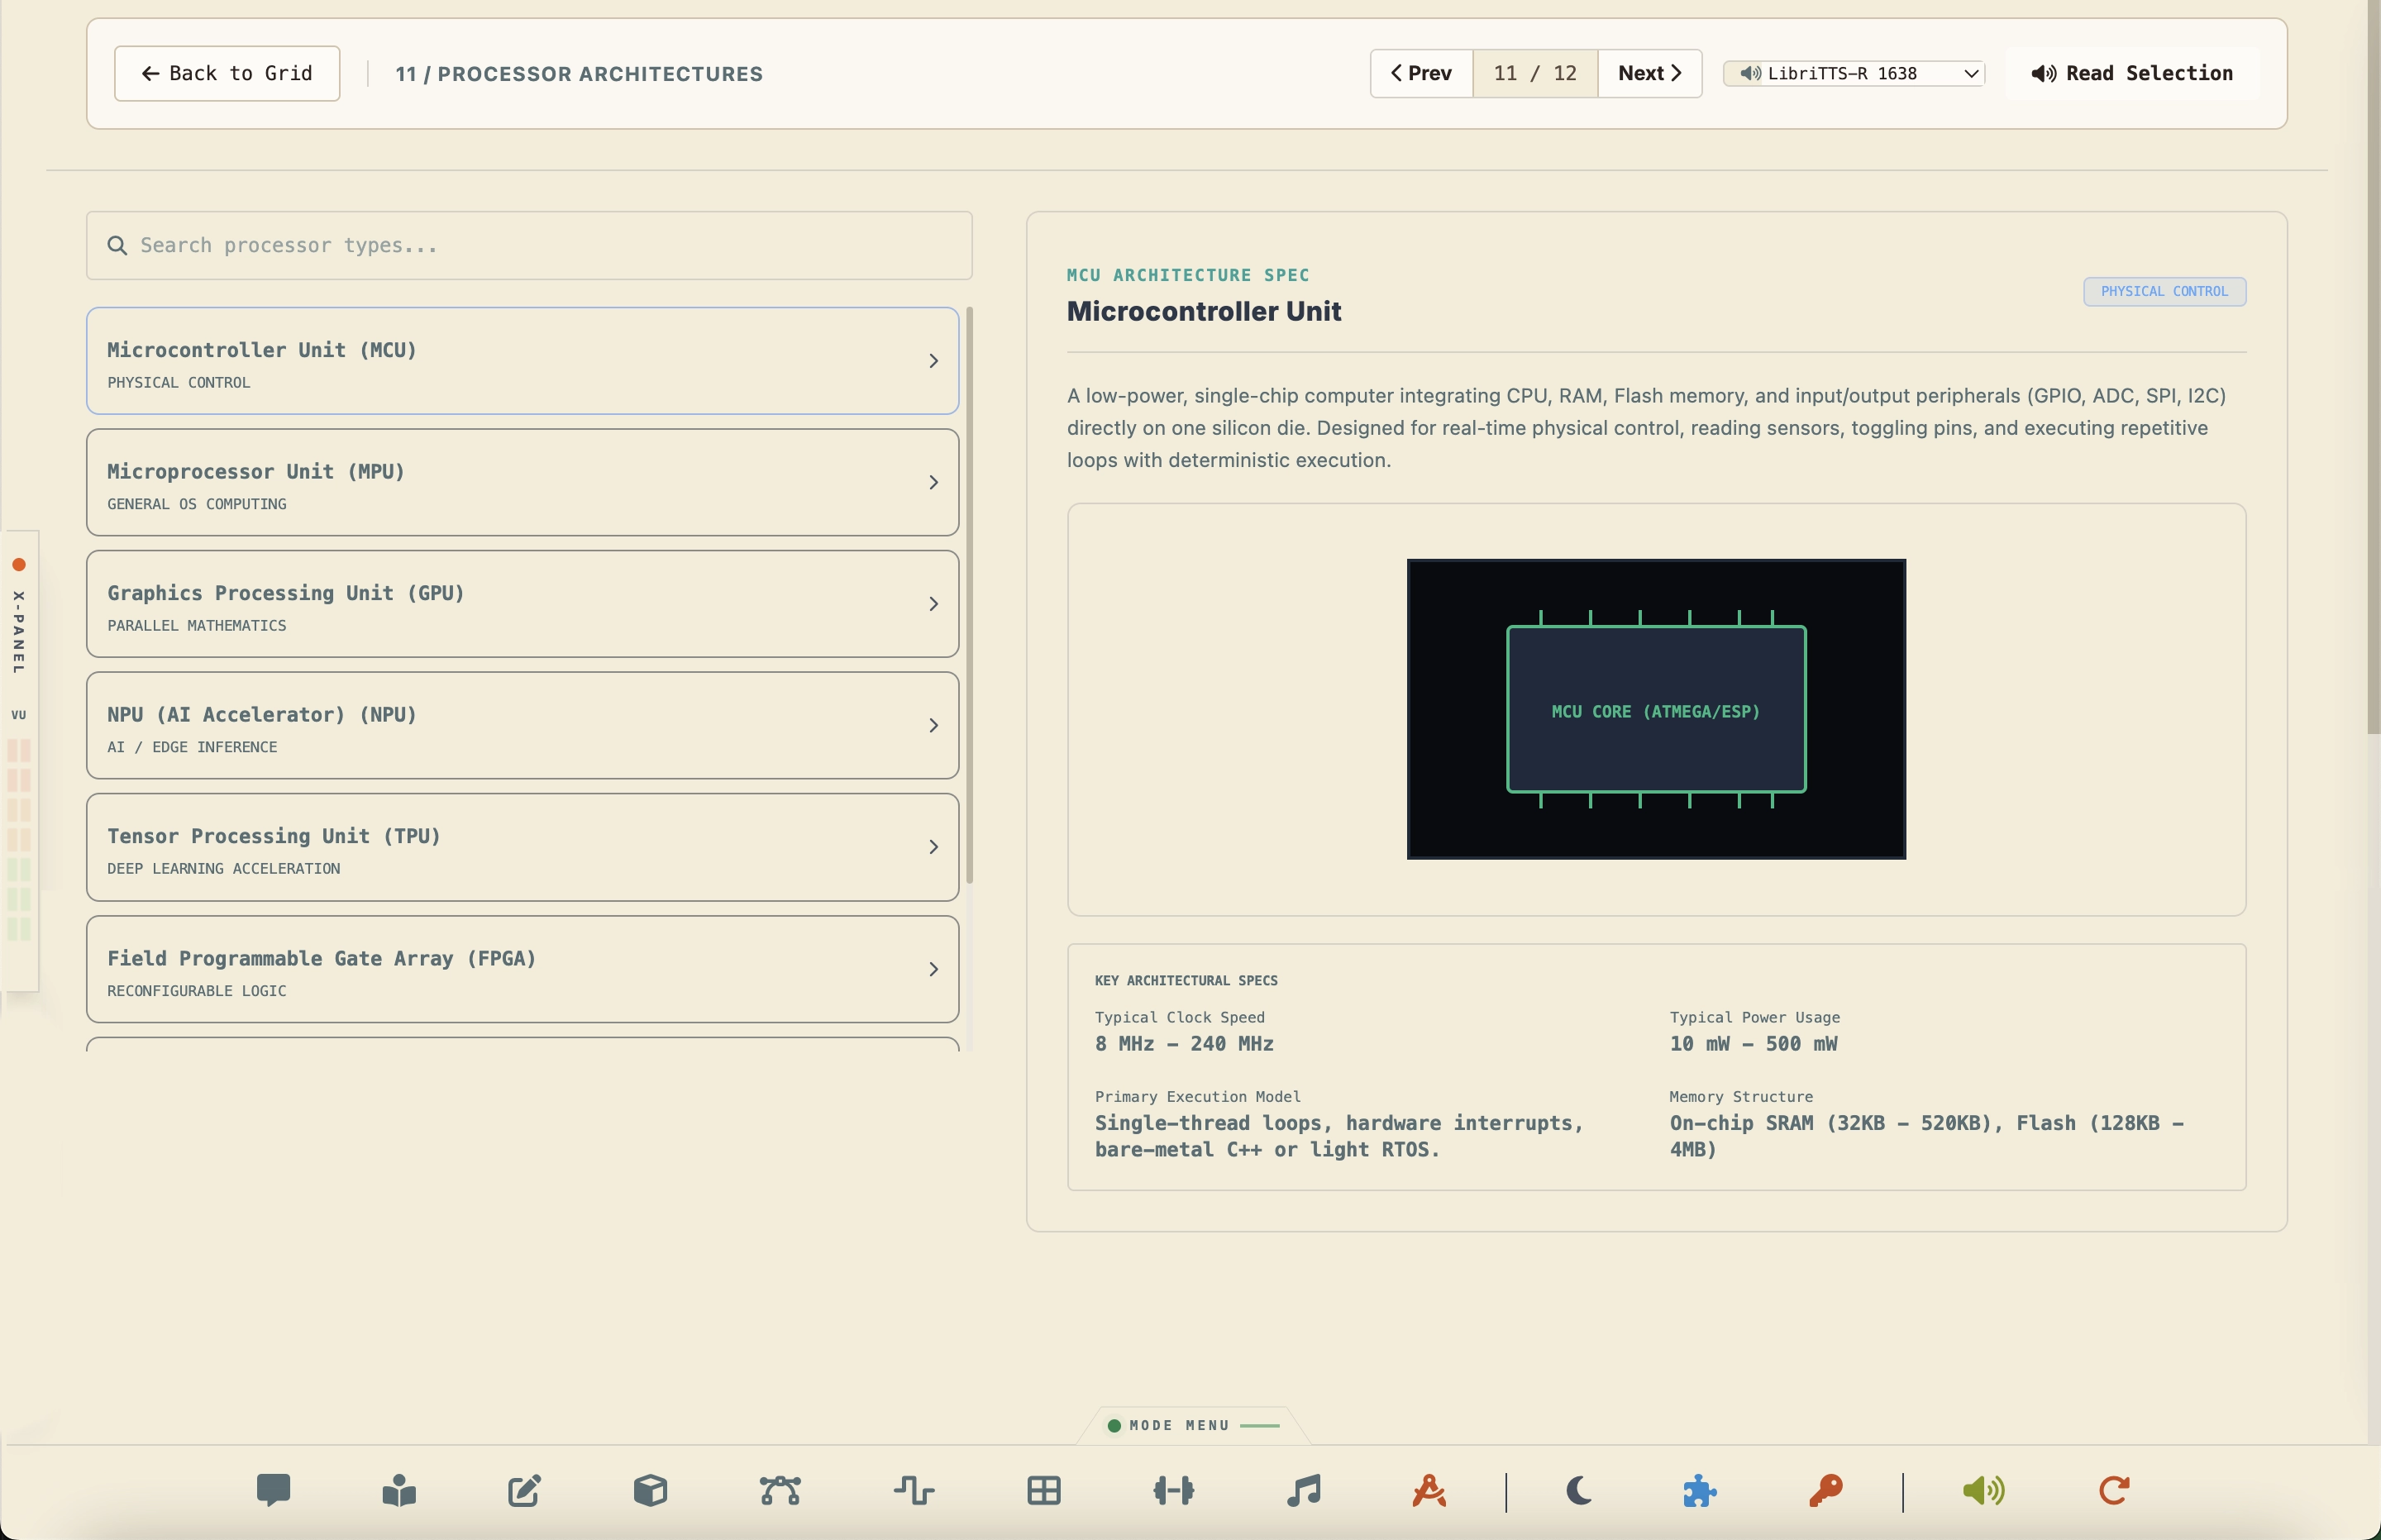
Glossary index defining studio terminology including Compute Nodes, Code Editor configurations, and biomechanical indicators.
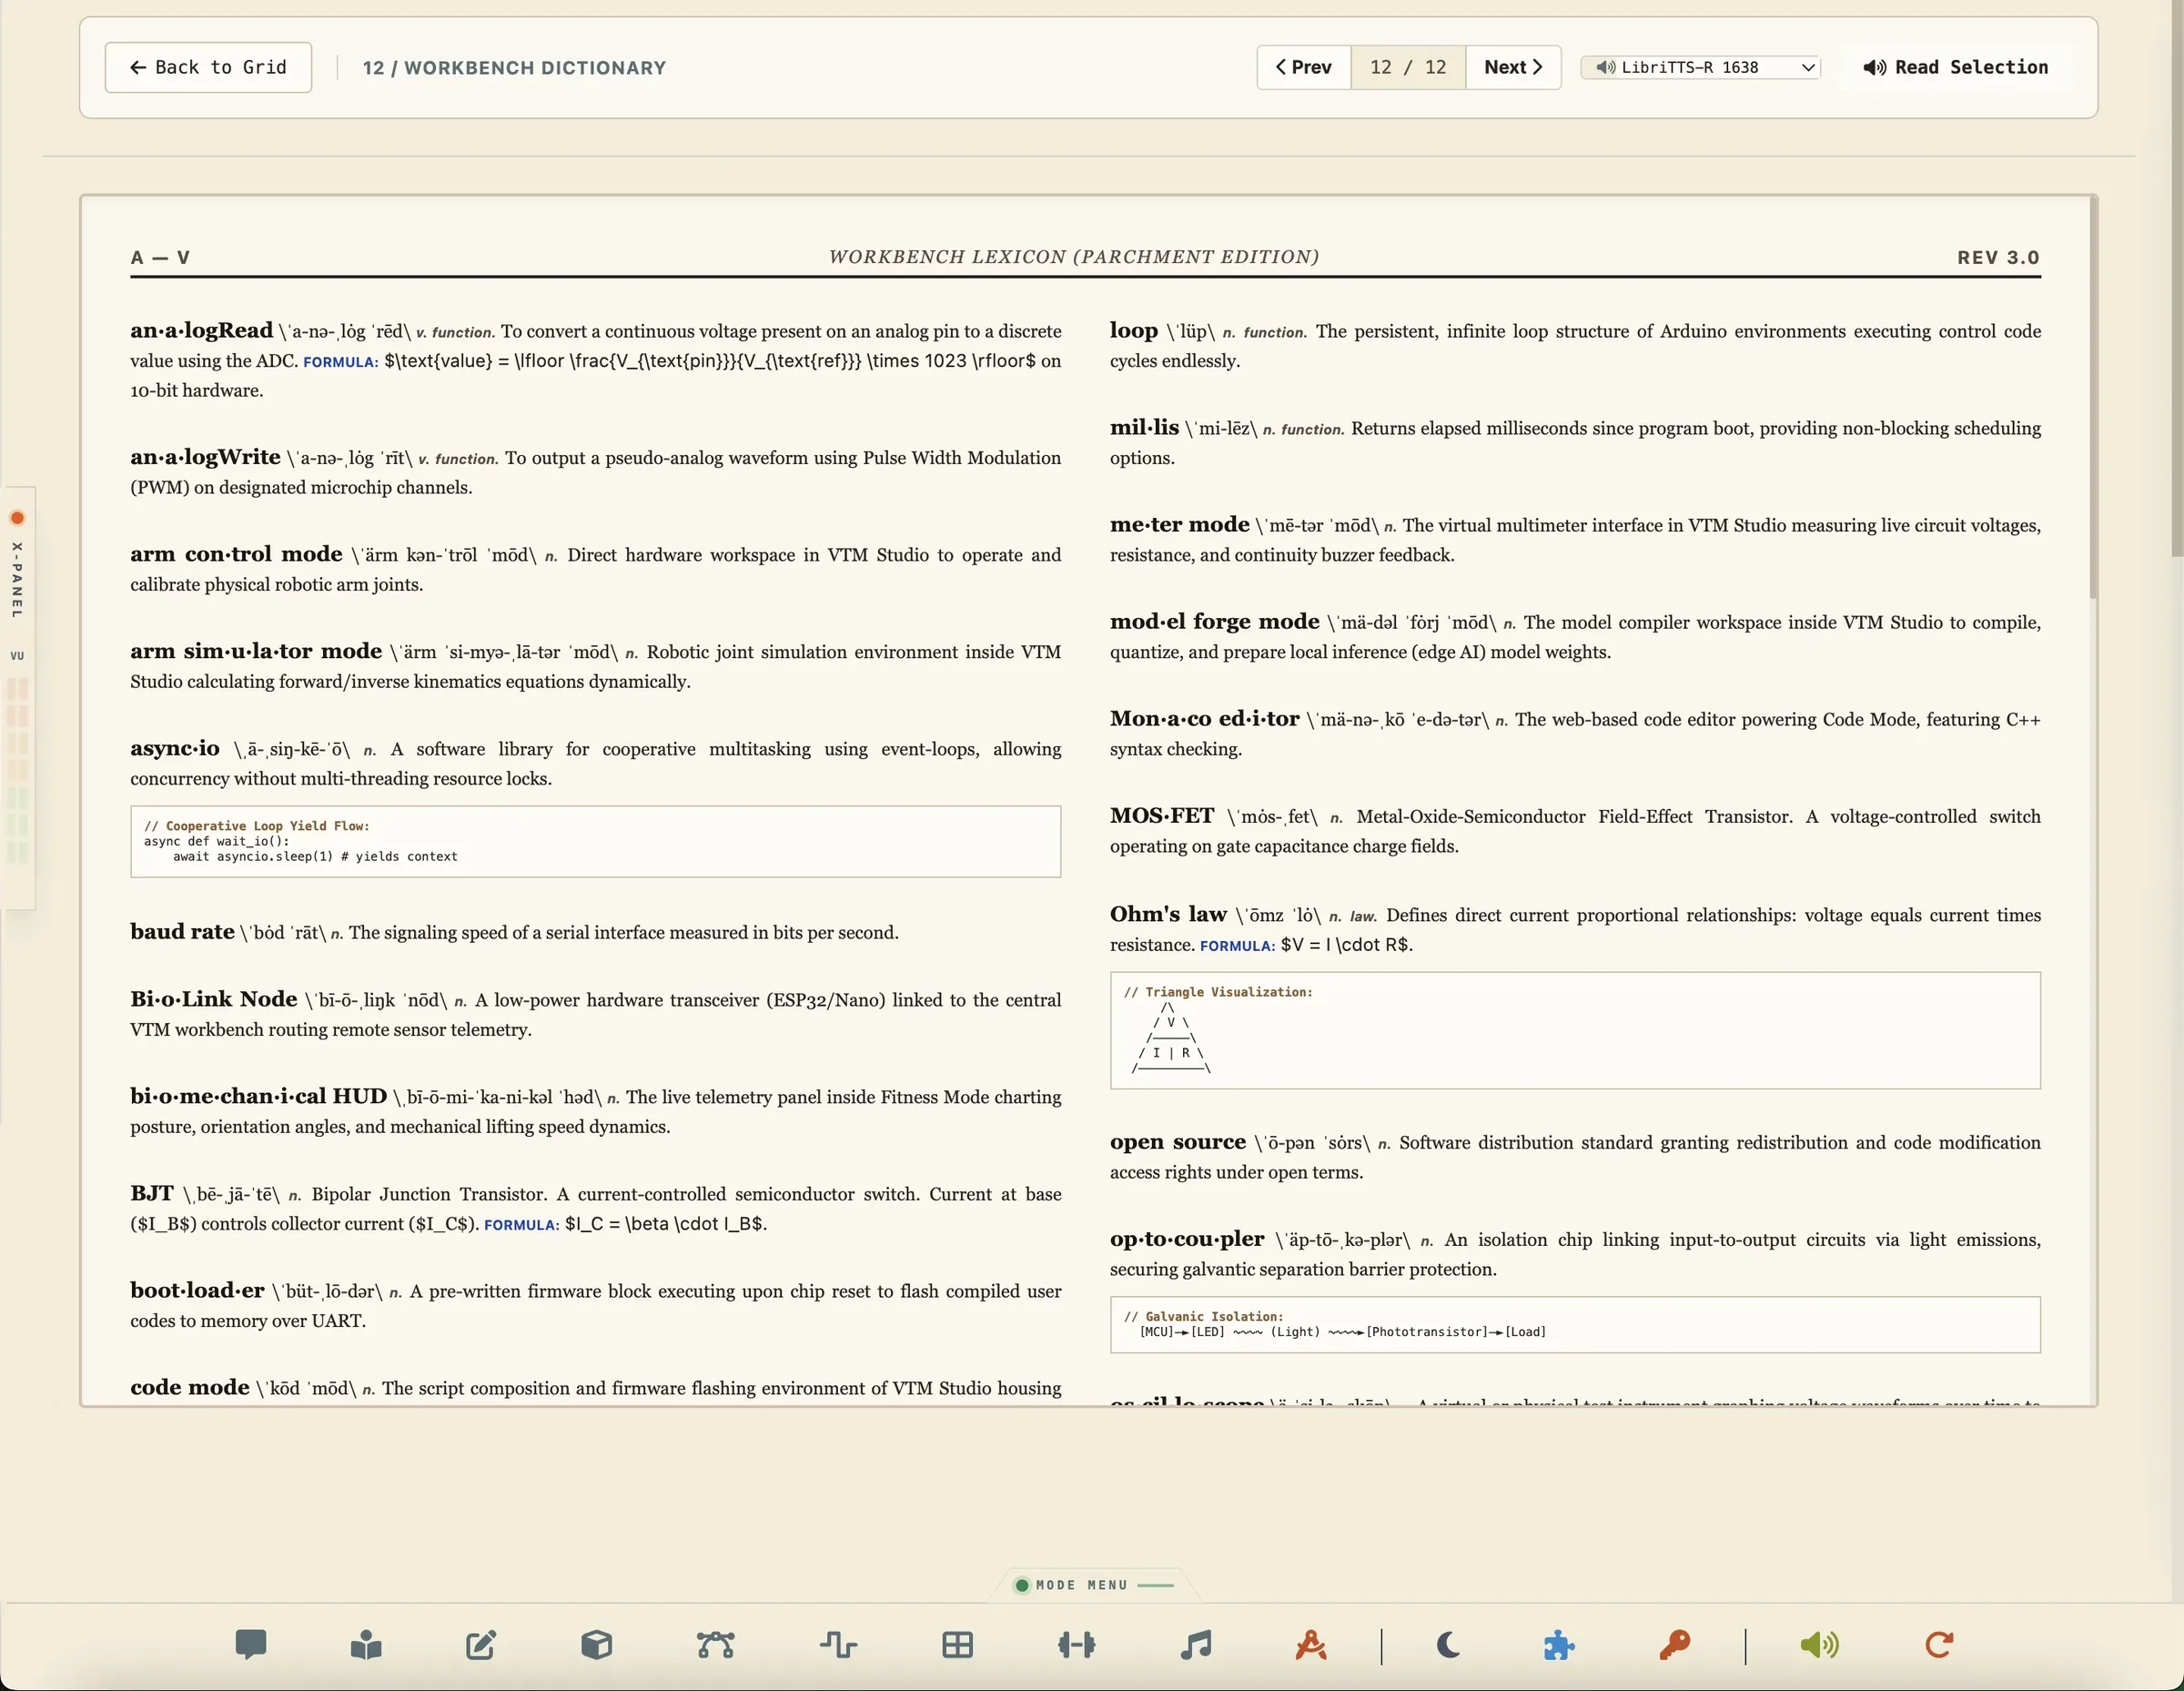
Section 5:19 — Converter Mode
High-speed batch processing utility (unlocked in the Maker Pro and Physical AI Pro packs) designed for multi-format image conversions, aspect ratio preservation, and Lanczos rescaling. Integrates dual input paths, allowing you to upload files directly from the browser selector or scan directory paths on your local computer.
You need to optimize raw PNG screenshots or high-resolution component photos into lightweight WebP assets for your project documentation or Layout Mode library. You select the target folder path, choose WEBP as the target format, input width/height constraints, and batch-convert the files in a single pass.
- Select the input source: Upload Files (via drag-and-drop or file browser) or Scan Folder Path (specifies a local directory on your computer).
- Choose target output extension: WEBP, PNG, JPEG, TIFF, GIF, or BMP.
- Optionally specify width and height in pixels and check Maintain aspect ratio to enable Lanczos anti-stretch scaling.
- Enter an optional target directory in Save Folder Path (defaults to source or output directory).
- Click Convert Queue to run batch processing and view real-time log feedback in the console terminal.
- Click Open Output Folder to view your converted files in your system file manager.
Section 5:20 — Study Mode
Study Mode (unlocked in the Maker Pro and Physical AI Pro packs) is a complete visual and spoken textbook analysis laboratory designed to expand your engineering, mathematical, and business knowledge. With this module, you can read open-access textbooks side-by-side with ARC T - A (AI Reasoning System - Textbook Assistant). ARC T - A acts as your dedicated study coordinator: you can ask it conceptual, academic, or brainstorming questions about the subject matter, or direct it to control the laboratory display—opening any textbook, navigating instantly to specific chapters and sections, or verbally controlling reading playback. You can also search key terms, stream spoken audio readouts paragraph-by-paragraph, and dynamically resize your panel views for optimum workspace layout.
You are studying the laws of electromagnetic induction. You load the physics textbook and navigate to the Faraday's Law chapter. As you read, ARC T - A follows along automatically, explaining the mathematical derivations, displaying the page text context in real-time, and preloading speech audio so you can listen hands-free while building circuit links.
The Study Mode catalog includes open-licensed college and engineering textbooks ready for on-demand reading and study (including OpenStax CC BY 4.0 titles available at openstax.org), such as:
- University Physics Volume 1
- University Physics Volume 2
- Introduction to Computer Science
- College Algebra
- Additive Manufacturing Essentials
- Algebra and Trigonometry
- Introduction to Python Programming
- Principles of Data Science
- Introduction to Intellectual Property
- Principles of Managerial Accounting
- Principles of Marketing
- Entrepreneurship
- Chemistry 2e
Maker, you can navigate your reference library using two distinct methods:
- Open Study Mode by clicking the Study Mode (graduation cap icon) button in the bottom navigation dock.
- Use the keyword search bar to locate specific terms (e.g., "Faraday") across the active book, revealing instant highlighted text snippets.
- Ask ARC T - A to explain any formula or concept. It reads the exact text on your screen to guide your explanation.
- Click the READ button or tell ARC T - A directly (e.g., "read this page") to start sequential audio narration. Listen to paragraph-by-paragraph readings, and tell the assistant to "stop" to halt playback at any time.
- Position your pointer on the vertical border between the panels and drag to resize the chat workspace, or click the collapsible handle tabs on either side to hide/show panels.
- Click the TOUR button in the header to walk through the layout sections, ARC T - A controls, and reading tools.
Section 5:21 — Mobile Sync & VTM Studio Lite™
The VTM Studio Lite™ mobile companion (available in the upcoming Maker Pro Go and P.A.P. n Go bundles) transforms your smartphone or tablet into a remote sensor array, voice transceiver, and hardware control deck. By streaming data over your network, your mobile device becomes a portable extension of your desktop workstation—allowing you to monitor telemetry, stream phone sensors, log workstation notes, and control servo axes from across the room.
The Mobile Connection HUD (Routing Your Signals)
To connect your desktop workstation and your mobile device, open the Mobile Connection HUD. This panel lets you choose the connection path for VTM Studio Lite™:
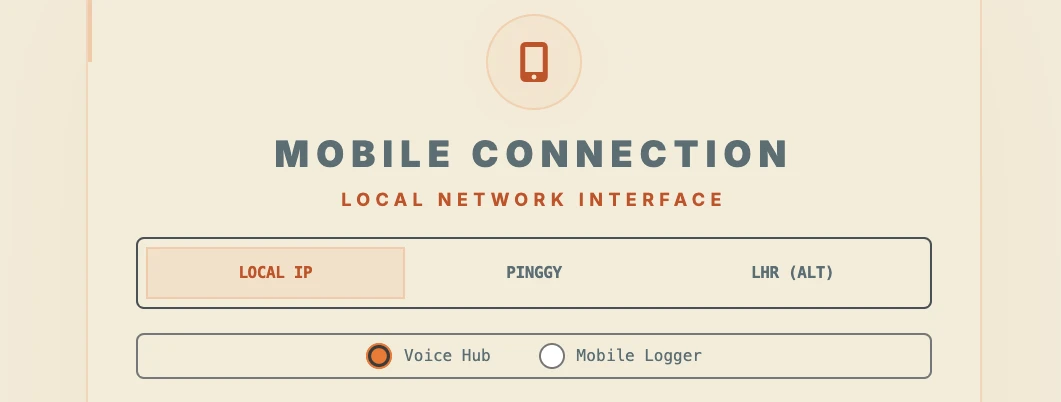
When your desktop computer and phone share the same local Wi-Fi network, this route establishes a direct peer-to-peer connection. Scan the generated QR code to connect immediately.
Establishes an encrypted tunnel so you can access your VTM Studio Lite™ mobile dashboard when local Wi-Fi client isolation blocks peer-to-peer LAN traffic.
Section A: Voice Hub Mode & Multimodal Sensor Stream
Voice Hub Mode inside VTM Studio Lite™ turns your phone into a hands-free wireless transceiver for your workstation. Tap the voice buttons to talk directly to your studio assistants—capturing build logs, dictating notes, or sending voice prompts while standing at your hardware setup.
Toggle on the Sensor Stream switch on your phone screen to broadcast your phone's internal hardware sensors to your desktop Science Mode dashboard at 10Hz:
- [AUDIO] Audio Volume (dB): Measures sound levels via the microphone to drive a live VU meter.
- [ACCEL] 3-Axis Accelerometer: Captures motion vectors (X, Y, Z axes) as you tilt or move the device.
- [COMPASS] Compass Heading: Tracks your phone's physical orientation in degrees.
- [LUX] Light Sensor (Lux): Measures ambient illumination from the phone sensor.
- [BARO] Barometer & Altimeter: Reads atmospheric pressure and estimated altitude.
- [GPS] GPS Locator: Streams latitude, longitude, and heading telemetry.
- [HALL] Hall Effect Proximity: Detects nearby magnetic fields.
- [UWB] UWB & LiDAR: Streams spatial distance and time-of-flight measurements on supported devices.
- [GYRO] 3-Axis Gyroscope: Streams angular velocity across pitch, roll, and yaw axes.
- [TOUCH] Touch Scanner: Streams interactive X/Y touch coordinates from your phone screen.
Section B: VTM Studio Lite™ Mobile Modes
The VTM Studio Lite™ mobile dashboard acts as your handheld control deck for logging notes, viewing live readouts, and adjusting servo hardware away from your monitor:
- [LOG] Mobile Maker Log Capture: Snap photos of your breadboard wiring, record voice memos, or jot down build observations on your phone that sync directly into your desktop Maker Log folders.
- [METER] Multimeter Mode Mirror: Probing a circuit on your desk? Mirror the live digital multimeter readout (DC Voltage, Resistance, and Continuity) directly on your phone screen with continuity audio tones.
- [ARM] Robotic Arm Override: Use mobile sliders to adjust individual joint angles (Base Rotate, Shoulder, Elbow, Wrist, Gripper) on your connected robotic arms over serial in real time.
- [DOCS] Mobile Manual Reader: Read and search the VTM Studio reference manual on your phone screen with high-contrast typography scaled for mobile legibility.
- [FITNESS] Fitness Mode & Splits (Coming Soon): Mobile workout split logging and exercise tracking that syncs with the upcoming Fitness Expansion Pack.
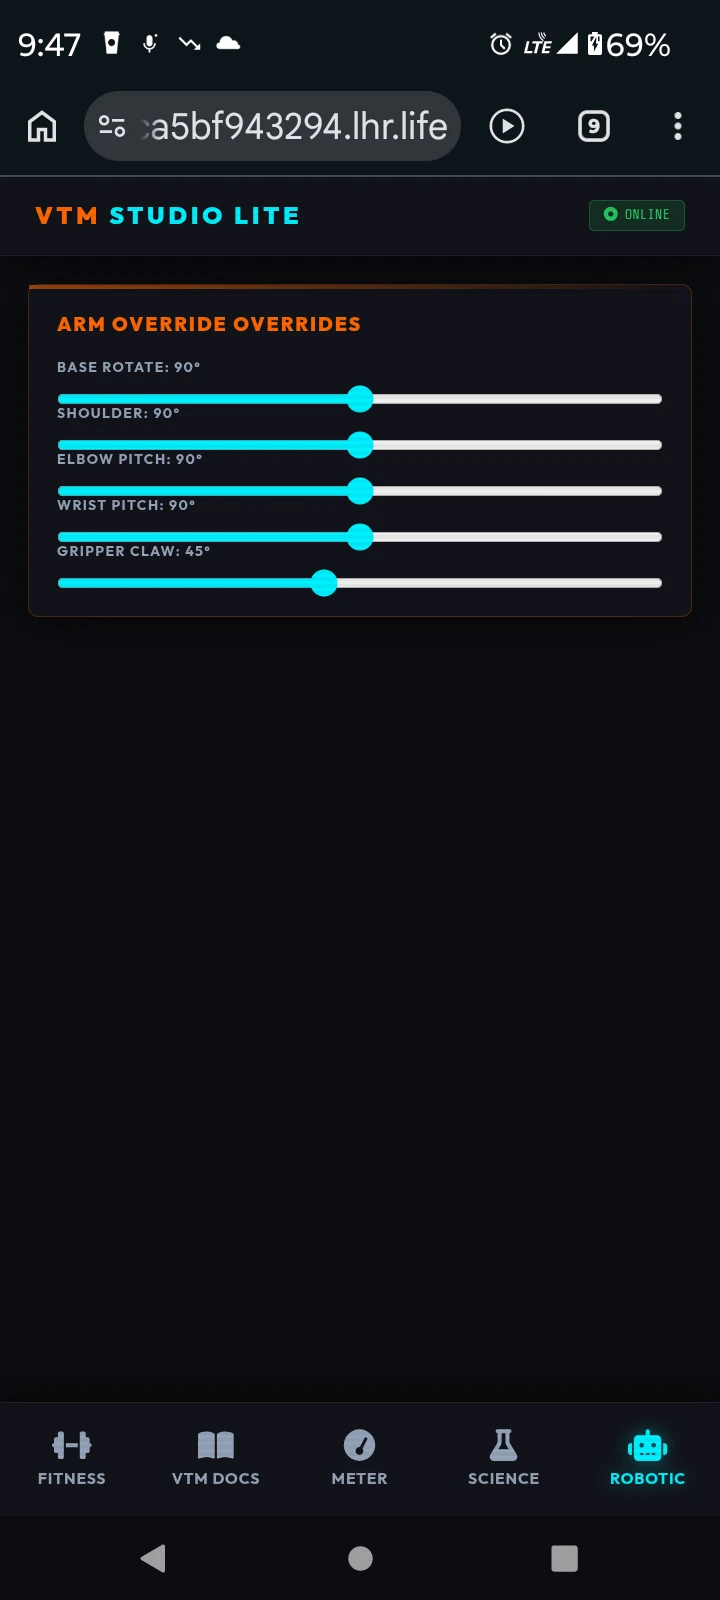
Section C: Adding VTM Studio Lite™ to Your Phone Home Screen
Once connected via QR code on your local Wi-Fi or Cloud Secure Link, you can save the VTM Studio Lite™ dashboard directly to your phone's home screen for fullscreen access:
- Open the VTM Studio Lite link in your mobile browser (such as Safari on iOS or Chrome on Android).
- Tap the browser's Share or menu button.
- Select Add to Home Screen.
- Confirm the name as VTM Studio Lite™ and tap Add.
This installs a dedicated home screen icon that launches VTM Studio Lite in fullscreen mode without browser address bars.
VTM Studio Lite™ Gallery
Explore these real-time views captured from the home laboratory, showing the Mobile Connection HUD, Voice Hub Mode, and physical instrumentation views:
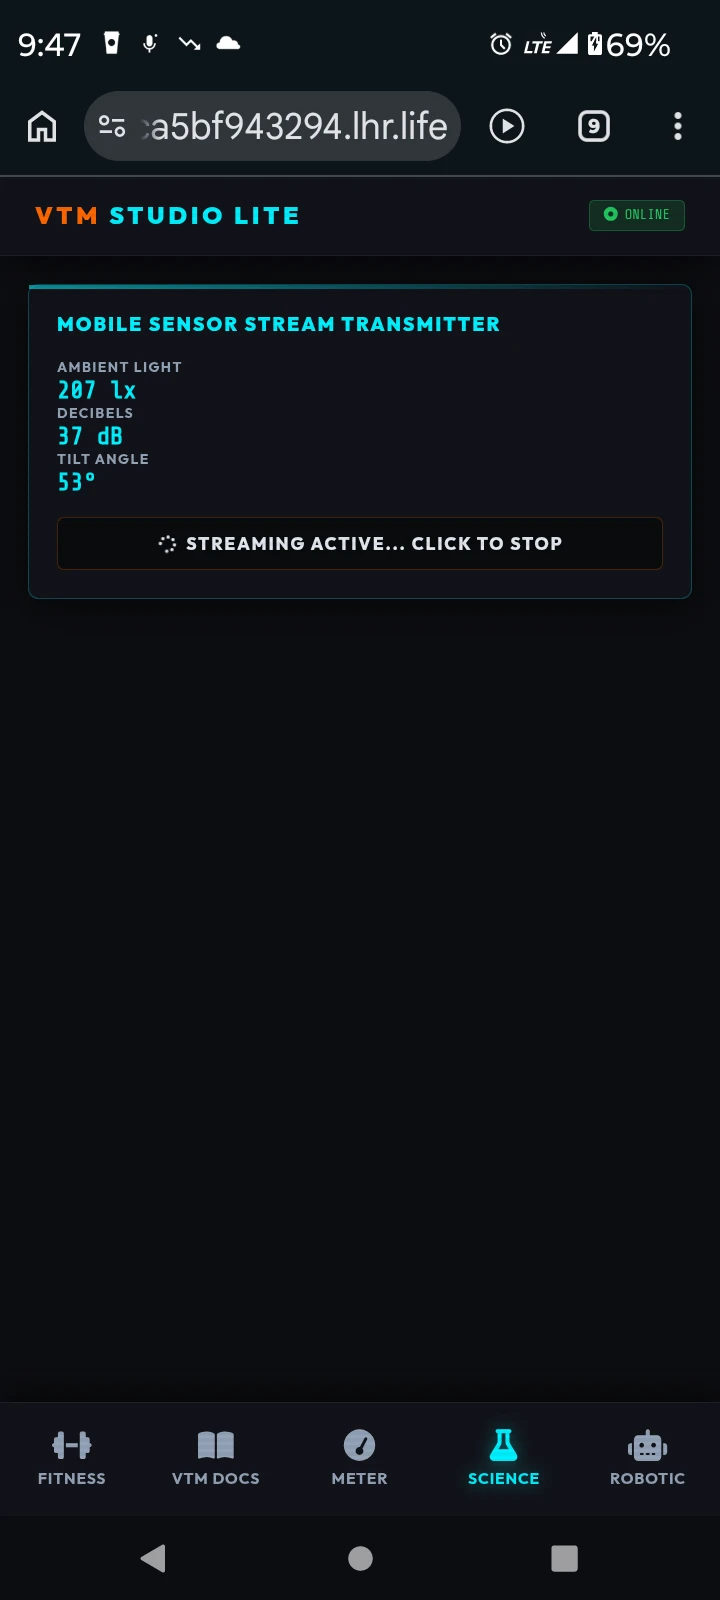
Chapter 6 — VTM Instruments™: Measurements and Reference Tools
You will notice throughout this manual that we frequently emphasize the importance of making precise circuit measurements. If you are going to truly understand electronic circuitry and physical computing, you must learn to measure circuit values—specifically low-voltage DC voltage, resistance (Ω), and continuity. Only then can you verify how signals and power flow between the software layer and your physical breadboard builds.
"When you can measure what you are speaking about, and express it in numbers, you know something about it; but when you cannot measure it, when you cannot express it in numbers, your knowledge is of a meager and unsatisfactory kind: it may be the beginning of knowledge, but you have scarcely, in your own thoughts, advanced to the state of science."
— LORD KELVIN, 1883
To provide this essential capability directly on your workstation, VTM Studio includes Meter Mode—a virtual digital multimeter designed for probing low-voltage breadboard circuits over USB serial—alongside a comprehensive suite of hardware reference utilities.
Section 6:1 — VTM Meter Mode (Virtual Multimeter)
VTM Meter Mode acts as your breadboard test instrument. It uses a backlit digital LCD, rotary selector dial, and 2-wire probe reference diagram (meter_sketch.ino) so you can probe low-voltage breadboard circuits directly using standard Dupont jumper wires connected to your microcontroller over USB serial.
The virtual multimeter console provides tactile controls modeled after a classic digital multimeter:
- Rotary Selector Dial: Click or scroll the rotary dial to select your measurement function:
OFF,DCV(Direct Current Voltage),OHM(Resistance Ω), andCONT(Continuity with audio tone). - HOLD Button: Freezes the active measurement on the backlit digital LCD display for logging and inspection.
- LIGHT Button: Toggles the digital LCD panel backlight on or off for clear visibility.
- 2-Wire Probe Reference Diagram: Shows the exact 2-wire Dupont probe hookup (Red Probe + and Black Probe COM/GND) on your microcontroller and breadboard.
- Direct Serial Readout: Connect your microcontroller over USB serial to measure real electronic components on your physical breadboard in real time.
- Integrated Probe Reference: The on-screen 2-wire probe reference diagram illustrates how to route your Dupont jumper probes between your breadboard test points and your microcontroller's analog and ground pins.
CRITICAL SAFETY LIMIT: Physical Dupont breadboard circuits and microcontroller pins are strictly rated for low-voltage logic (5V DC maximum on 5V boards, 3.3V on 3.3V boards, and 1.8V on 1.8V MPU headers). Never attempt to measure mains AC house voltage (110V/240V) or high-voltage rails. Doing so will permanently destroy your hardware and presents an immediate safety hazard.
To stream live measurements to Meter Mode, flash the companion multimeter sketch to your microcontroller:
- Sketch Deployment: Flash the
meter_sketch.inofirmware onto your microcontroller. - Signal Mapping: The sketch reads the analog probe input and reference divider, converts ADC counts into DC voltage (
DCV), resistance (Ω), and continuity state, and streams the readings over USB serial. - Connection: Select your microcontroller's USB serial port in Meter Mode and click Connect to start live probing.
Follow the on-screen 2-wire probe reference diagram to measure low-voltage breadboard circuits:
- DC Voltage Probing (DCV): Touch the Red probe wire (connected to analog pin
A0) to the target breadboard node and connect the Black probe wire to sharedGND(strictly within your board's safe logic voltage limit). - Resistance Measurement (OHM): Use the 10kΩ reference voltage divider on your breadboard as shown in the 2-wire probe reference diagram to measure unknown resistor values (Rx).
- Continuity Test (CONT): Probe across two points on your unpowered breadboard path; low resistance triggers the continuity indicator and audible beep tone.
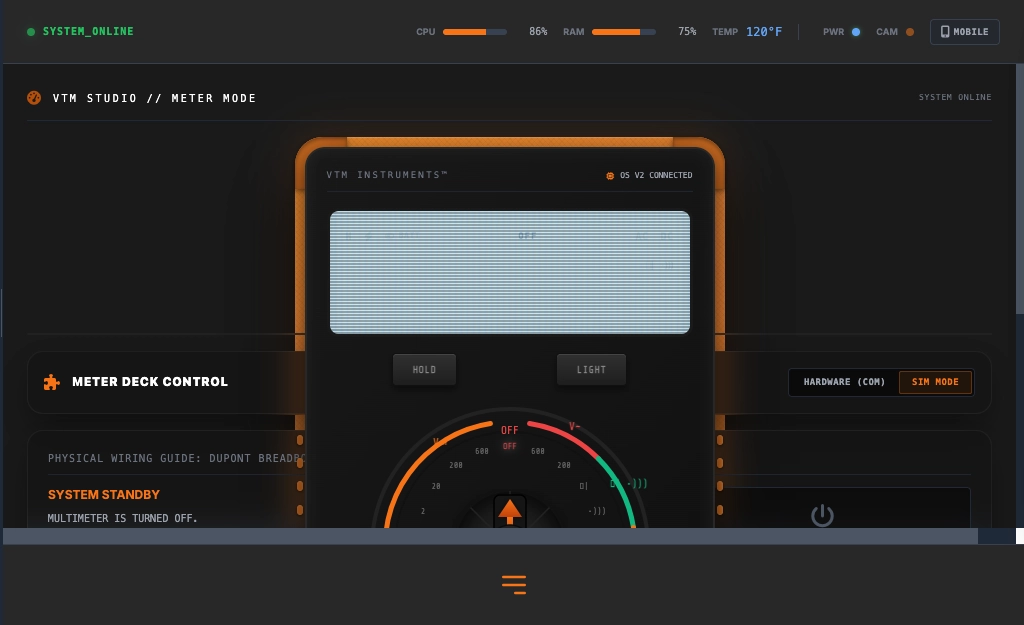
Chapter 7 — VTM OS (v1 Prototype) Repository: Open DIY Sandbox
VTM OS (VideotronicMaker-OS) was an early, standalone v1 prototype that
Tishin made free and open-source and left open on GitHub for the maker community.
VTM Studio (Version 2.2) is a separate, much larger, and far more robust commercial
desktop software workstation.
The VTM Pro-Maker Workbench starts with the software—VTM Studio—and
leads to your physical build of whatever you can imagine: a desktop robot torso with arms, one of the
P³ (Physical Prototyping Platform) build concepts (Maker Pro P³,
Chef P³, Fitness P³, Entry Sentry P³), a physical computing
workstation, a multi-display console, or a rack of lights and sensors. You do not need proprietary
hardware to use VTM Studio; it works with the boards, servos, sensors, and cameras you already own.
Alongside the commercial VTM Studio 2.2 desktop workstation, the separate early v1 VTM OS prototype repository remains publicly available on GitHub as an open DIY sandbox for students and makers who want to inspect early Flask routes, browser UI experiments, and basic serial scripts:
The early v1 prototype repository is hosted publicly on GitHub at:
https://github.com/VideotronicMaker/VideotronicMaker-OS
Section 7:1 — Open-Architecture Foundation (v1 Prototype)
The open-source v1 prototype repository provides a simple starting point for makers who want to study how a Python web server and microcontroller communicate over USB serial:
- Microcontroller Sketches: Baseline C++ sketches for coordinating basic servo movements, LED matrix animations, and serial packets.
- Lightweight Flask Wrapper: Early Python/Flask route examples and serial bindings for browser-to-board experiments.
- Physical Build Inspiration: Reference notes for pairing software controls with your own custom physical workbench or robot frame.
Section 7:2 — Licensing & Community Standards
To protect the community and ensure it remains a resource for makers, the VTM OS (v1) repository operates under a non-commercial licensing model:
- Creative Commons (CC BY-NC-SA 4.0): The v1 prototype files are free for personal learning, classroom study, and maker experimentation. Redistribution for profit, bundling, or commercial exploitation is strictly prohibited.
- Separate Commercial Product (VTM Studio 2.2): VTM Studio (Version 2.2) is a separate commercial desktop software workstation with native installers, VAS-X voice and prompt navigation, Study Mode engineering textbooks, and Model Forge's local model compaction studio.
Software-to-Physical Vision
Whether you build with VTM Studio (Version 2.2) or experiment with the early VTM OS (v1) prototype repository, the goal is honest, hands-on craftsmanship: starting from software on your computer and leading to your own physical build—a robot torso, a P³ platform concept, a multi-display console, or a sensor and lighting workstation.
Iteration & Community Standards
"This OS is not a product; it's a prototype. If you see a feature missing, build it. If you see a bug, patch it. I am sharing my notes so you can find your own way."
- How to Build Your Own View (v1 Prototype): Every view in the open-source v1 prototype is a modular HTML section with its own view ID and navigation trigger so students and makers can experiment with adding custom tools.
- Status: Published, open-source, and ready for community forking.